Complete Solutions to QUESTION BANK of chapter BAR GRAPHS of Class 6 book with complete answers and questions
| Class 6 | MATHS |
| Chapter | BAR GRAPHS |
| NAVNEET PUBLICATION | QUESTION BANK |
| Number Of Questions | 5 |
| Academic Year | 2023-24 |
This bar graph shows the temperatures in degree Celsius in different cities on a certain day in February. Observe the graph and answer the questions :
What data is shown on the vertical and the horizontal lines ? `
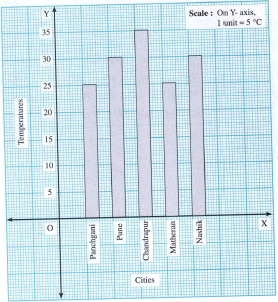
View SolutionThis bar graph shows the temperatures in degree Celsius in different cities on a certain day in February. Observe the graph and answer the questions :
Which city had the highest temperature ?
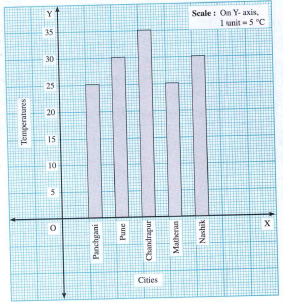
View SolutionThis bar graph shows the temperatures in degree Celsius in different cities on a certain day in February. Observe the graph and answer the questions :
Which cities had equal maximum temperatures ?
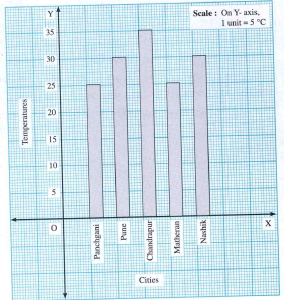
View SolutionThis bar graph shows the temperatures in degree Celsius in different cities on a certain day in February. Observe the graph and answer the questions :
Which cities had a maximum temperature of `30^@C` ?
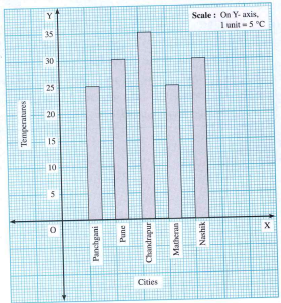
View SolutionThis bar graph shows the temperatures in degree Celsius in different cities on a certain day in February. Observe the graph and answer the questions :
What is the difference between the maximum temperatures of Panchgani and Chandrapur ?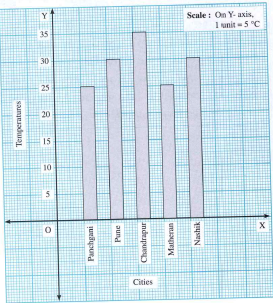
View Solution
QUESTION BANK questions and complete solutions for chapter BAR GRAPHS of NAVNEET MATHS (MARATHI ENGLISH) of Class 6