Complete Solutions to EXERCISE 9.3 of chapter DATA HANDLING of Class 6 book with complete answers and questions
| Class 6 | MATHS |
| Chapter | DATA HANDLING |
| Mathematics | EXERCISE 9.3 |
| Number Of Questions | 3 |
| Academic Year | 2023-24 |
Observe this bar graph which shows the marks obtained by Aziz in half-yearly examination in different subjects.
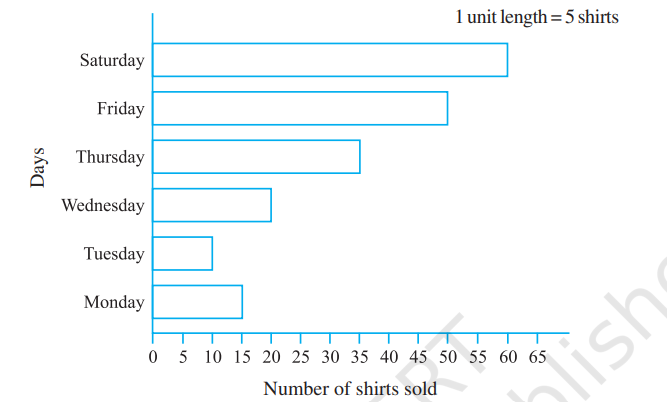
02:09View SolutionObserve this bar graph which is showing the sale of shirts in a ready made shop from Monday to Saturday
 03:06View Solution
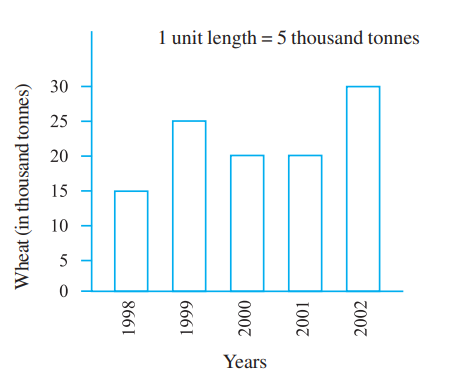
The bar graph given alongside shows the amount of wheat purchasedby government during the year 1998-2002. Read the bar graph andwrite down your observations. In which year was(a) the wheat production maximum?(b) the wheat production minimum?
 01:39View Solution
EXERCISE 9.3 questions and complete solutions for chapter DATA HANDLING of NCERT MATHEMATICS(Hinglish) of Class 6
