Complete Solutions to SOLVED EXAMPLES of chapter DATA HANDLING of Class 6 book with complete answers and questions
| Class 6 | MATHS |
| Chapter | DATA HANDLING |
| Mathematics | SOLVED EXAMPLES |
| Number Of Questions | 9 |
| Academic Year | 2023-24 |
Following table shows the monthly expenditure of Imran’s familyon various items.
04:30View SolutionFollowing is the pictograph of the number of wrist watches manufactured by a factory in a particular week.
(i) On which day were least number of wrist watches manufactured?
(ii) On which day were maximum number of wrist watches manufactured?
(iii) Find out the appropriate number of wrist watches manufactured in this particular week?
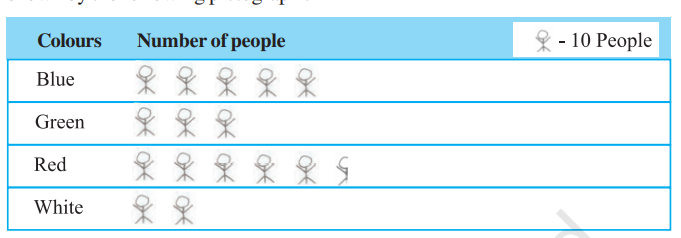
03:38View SolutionThe colours of fridges preferred by people living in a locality are shown by the following pictograph

a) Find the number of people preferring blue colour
b)How many people like red colour01:18View SolutionA survey was carried out on `30` students of class `VI` in a school. Data about the different modes of transport used by them to travel to school was displayed as pictograph. What can you conclude from the pictograph?
01:56View SolutionEkta is asked to collect data for size of shoes of students in her Class VI. Her finding are recorded in the manner shown below
 02:00View Solution
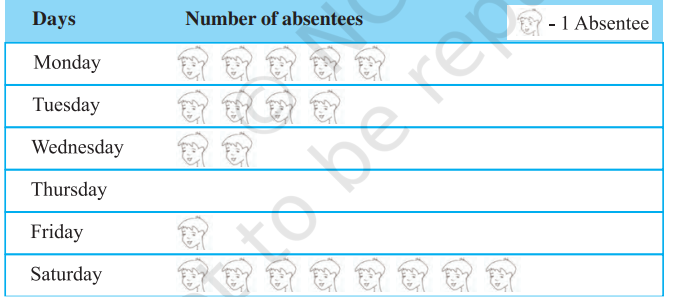
The following pictograph shows the number of absentees in aclass of 30 students during the previous week

(a) On which day were the maximum number of students absent?
(b) Which day had full attendance?
(c) What was the total number of absentees in that week?01:50View SolutionA teacher wants to know the choice of food of each student aspart of the mid-day meal programme. The teacher assigns the task ofcollecting this information to Maria. Maria does so using a paper and a pencil. After arranging the choices in a column, she puts against a choice of food one ( | ) mark for every student making that choice.
02:50View SolutionThe following are the number of electric bulbs purchased for alodging house during the first four months of a year
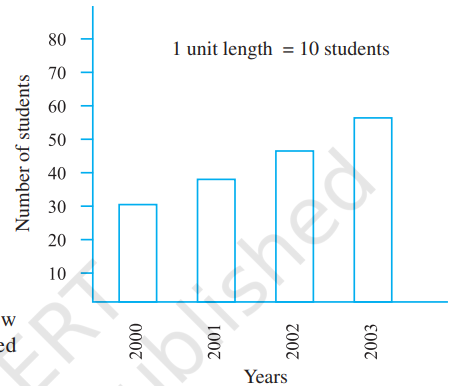
01:56View SolutionRead the adjoining bar graph showing the number ofstudents in a particular class of a school. Answer thefollowing questions :(a) What is the scale of this graph?(b) How many new students are added every year?(c) Is the number of students in the year 2003 twice that in the year 2000?
 01:58View Solution
SOLVED EXAMPLES questions and complete solutions for chapter DATA HANDLING of NCERT MATHEMATICS(Hinglish) of Class 6
