Complete Solutions to EXERCISE - 8.2 of chapter DATA HANDLING of Class 6 book with complete answers and questions
| Class 6 | MATHS |
| Chapter | DATA HANDLING |
| ANDHRA PRADESH SCERT | EXERCISE - 8.2 |
| Number Of Questions | 34 |
| Academic Year | 2023-24 |
The number of wrist watches manufactured by a factory in a week are as follows. Represent the data using a pictograph. Choose a suitable scale.

View Solutiondetails of apples sold in a week by Ahmed, a fruit vendor are given here under. Prepare a pictograph for the data: [Scale: Represent 5 fruits with a symbol] : How many symbols represent the fruit sold on Tuesday?

View Solutiondetails of apples sold in a week by Ahmed, a fruit vendor are given here under. Prepare a pictograph for the data: [Scale: Represent 5 fruits with a symbol] : How many symbols represent the fruit sold on Tuesday?

View SolutionVotes polled for various candidates in a sarpanch election are shown below, against their symbols in the following table.

Represent the data using a pictograph. Choose a suitable scale.
Answer the following questions:
Which symbol got least votes?
View SolutionVotes polled for various candidates in a sarpanch election are shown below against their symbols in the following table. Represent the data using a pictograph. Choose a suitable scale: Which symbol candidate won in the election?

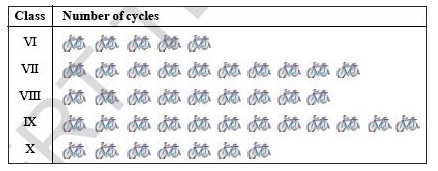
View SolutionThe following pictograph shows the number of students’ cycles, in five classes of a school. Which class students have the maximum number of cycles?
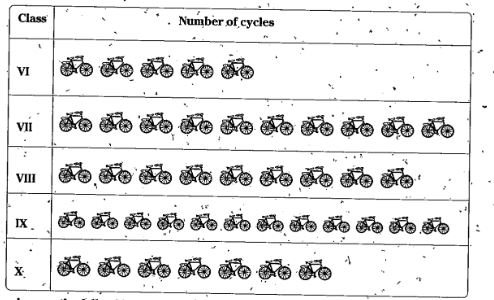
View SolutionThe following pictograph shows the number of student cycles, in five classes of a school.

Answer the following questions based on the pictograph given above-
Which class students have the minimum number of cycles?
View SolutionThe following pictograph shows the number of students’ cycles, in five classes of a school. Which class students have 9 cycles?
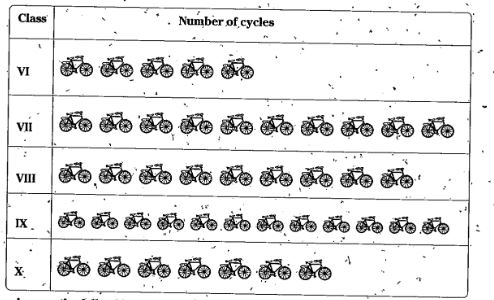
View SolutionThe following pictograph shows the number of student cycles, in five classes of a school.
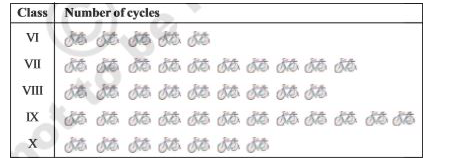
Answer the following questions based on the pictograph given above-
What is the total number of cycles in all the five classes?
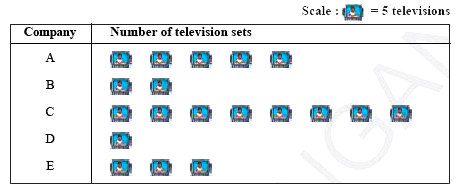
View SolutionThe sale of television sets of different companies on a day is shown in the pictograph given below.

Answer the following questions:
How many TVs of company A were sold?
View SolutionThe sale of television sets of different companies on a day is shown in the pictograph given below.
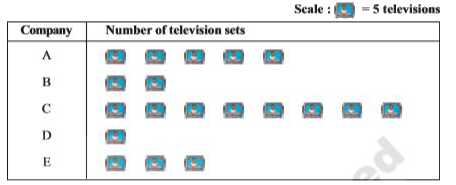
Answer the following questions:
Which company's TVs are people more crazy about?
View SolutionThe sale of television sets of different companies on a day is shown in the pictograph given below.

Answer the following questions:
Which company sold 15 TV sets?
View SolutionThe sale of television sets of different companies on a day is shown in the pictograph given below.

Answer the following questions:
Which company had the least sale?
View SolutionMonthly salaries of 5 workers are shown in the pictograph given below: Who earns more salary?
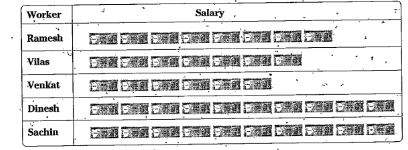
View SolutionMonthly salaries of 5 workers are shown in the pictograph given below: Who earns more salary?

View SolutionMonthly salaries of 5 workers are shown in the pictograph given below: Who earns more salary?

View SolutionMonthly salaries of 5 workers are shown in the pictograph given below: Who earns more salary?

View SolutionThe number of wrist watches manufactured by a factory in a week are as follows. Represent the data using a pictograph. Choose a suitable scale.

View Solutiondetails of apples sold in a week by Ahmed, a fruit vendor are given here under. Prepare a pictograph for the data: [Scale: Represent 5 fruits with a symbol] : How many symbols represent the fruit sold on Tuesday?

View Solutiondetails of apples sold in a week by Ahmed, a fruit vendor are given here under. Prepare a pictograph for the data: [Scale: Represent 5 fruits with a symbol] : How many symbols represent the fruit sold on Tuesday?

View SolutionVotes polled for various candidates in a sarpanch election are shown below, against their symbols in the following table.

Represent the data using a pictograph. Choose a suitable scale.
Answer the following questions:
Which symbol got least votes?
View SolutionVotes polled for various candidates in a sarpanch election are shown below against their symbols in the following table. Represent the data using a pictograph. Choose a suitable scale: Which symbol candidate won in the election?

View SolutionThe following pictograph shows the number of student cycles, in five classes of a school.

Answer the following questions based on the pictograph given above-
Which class students have the maximum number of cycles?
View SolutionThe following pictograph shows the number of student cycles, in five classes of a school.

Answer the following questions based on the pictograph given above-
Which class students have the minimum number of cycles?
View SolutionThe following pictograph shows the number of students’ cycles, in five classes of a school. Which class students have 9 cycles?

View SolutionThe following pictograph shows the number of student cycles, in five classes of a school.
Answer the following questions based on the pictograph given above-
What is the total number of cycles in all the five classes?
View SolutionThe sale of television sets of different companies on a day is shown in the pictograph given below.

Answer the following questions:
How many TVs of company A were sold?
View SolutionThe sale of television sets of different companies on a day is shown in the pictograph given below.
Answer the following questions:
Which company's TVs are people more crazy about?
View SolutionThe sale of television sets of different companies on a day is shown in the pictograph given below.

Answer the following questions:
Which company sold 15 TV sets?
View SolutionThe sale of television sets of different companies on a day is shown in the pictograph given below.
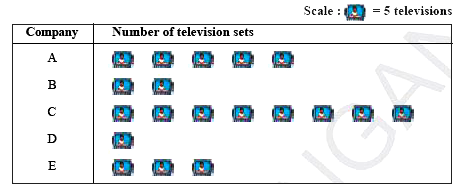
Answer the following questions:
Which company had the least sale?
View SolutionMonthly salaries of 5 workers are shown in the pictograph given below: What is the scale used in the pictograph?
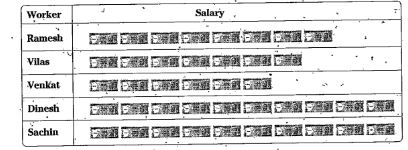
View SolutionMonthly salaries of 5 workers are shown in the pictograph given below:

Answer the following questions:
How much is Sachin's salary?
View SolutionMonthly salaries of 5 workers are shown in the pictograph given below: Who earns more salary?

View SolutionMonthly salaries of 5 workers are shown in the pictograph given below:
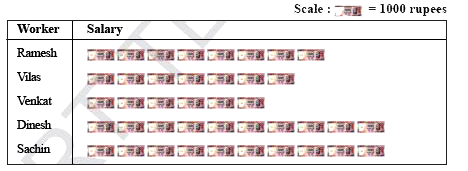
Answer the following questions:
How much is Ramesh's salary more than Vilas's?
View Solution
EXERCISE - 8.2 questions and complete solutions for chapter DATA HANDLING of NCERT MATHS(TELUGU) of Class 6