Complete Solutions to TEST YOUR CONCEPTS (VERY SHORT ANSWER TYPE QUESTION ) of chapter STATISTICS of Class 6 book with complete answers and questions
| Class 6 | MATHS |
| Chapter | STATISTICS |
| PEARSON IIT JEE FOUNDATION | TEST YOUR CONCEPTS (VERY SHORT ANSWER TYPE QUESTION ) |
| Number Of Questions | 11 |
| Academic Year | 2023-24 |
In a bar graph, if a bar of height 4 cm represents 28 units, the height of a bar representing 350 units is _______ .
01:15View SolutionIn a pie chart, the sum of the angles of all its com-ponents is ________ .
01:25View SolutionIn a pie chart, the central angle of the component 120, when the total value is 360 is _________ .
01:26View SolutionIn a bar graph, a bar of length 3.2 cm represents 96 units, then the number of units represented by a bar graph of length 2.1 cm is _________ .
01:28View SolutionIn a pie chart, if the central angle of a component is `108^(@)` and its value is 24, then the total value of all the components of the data is __________ .
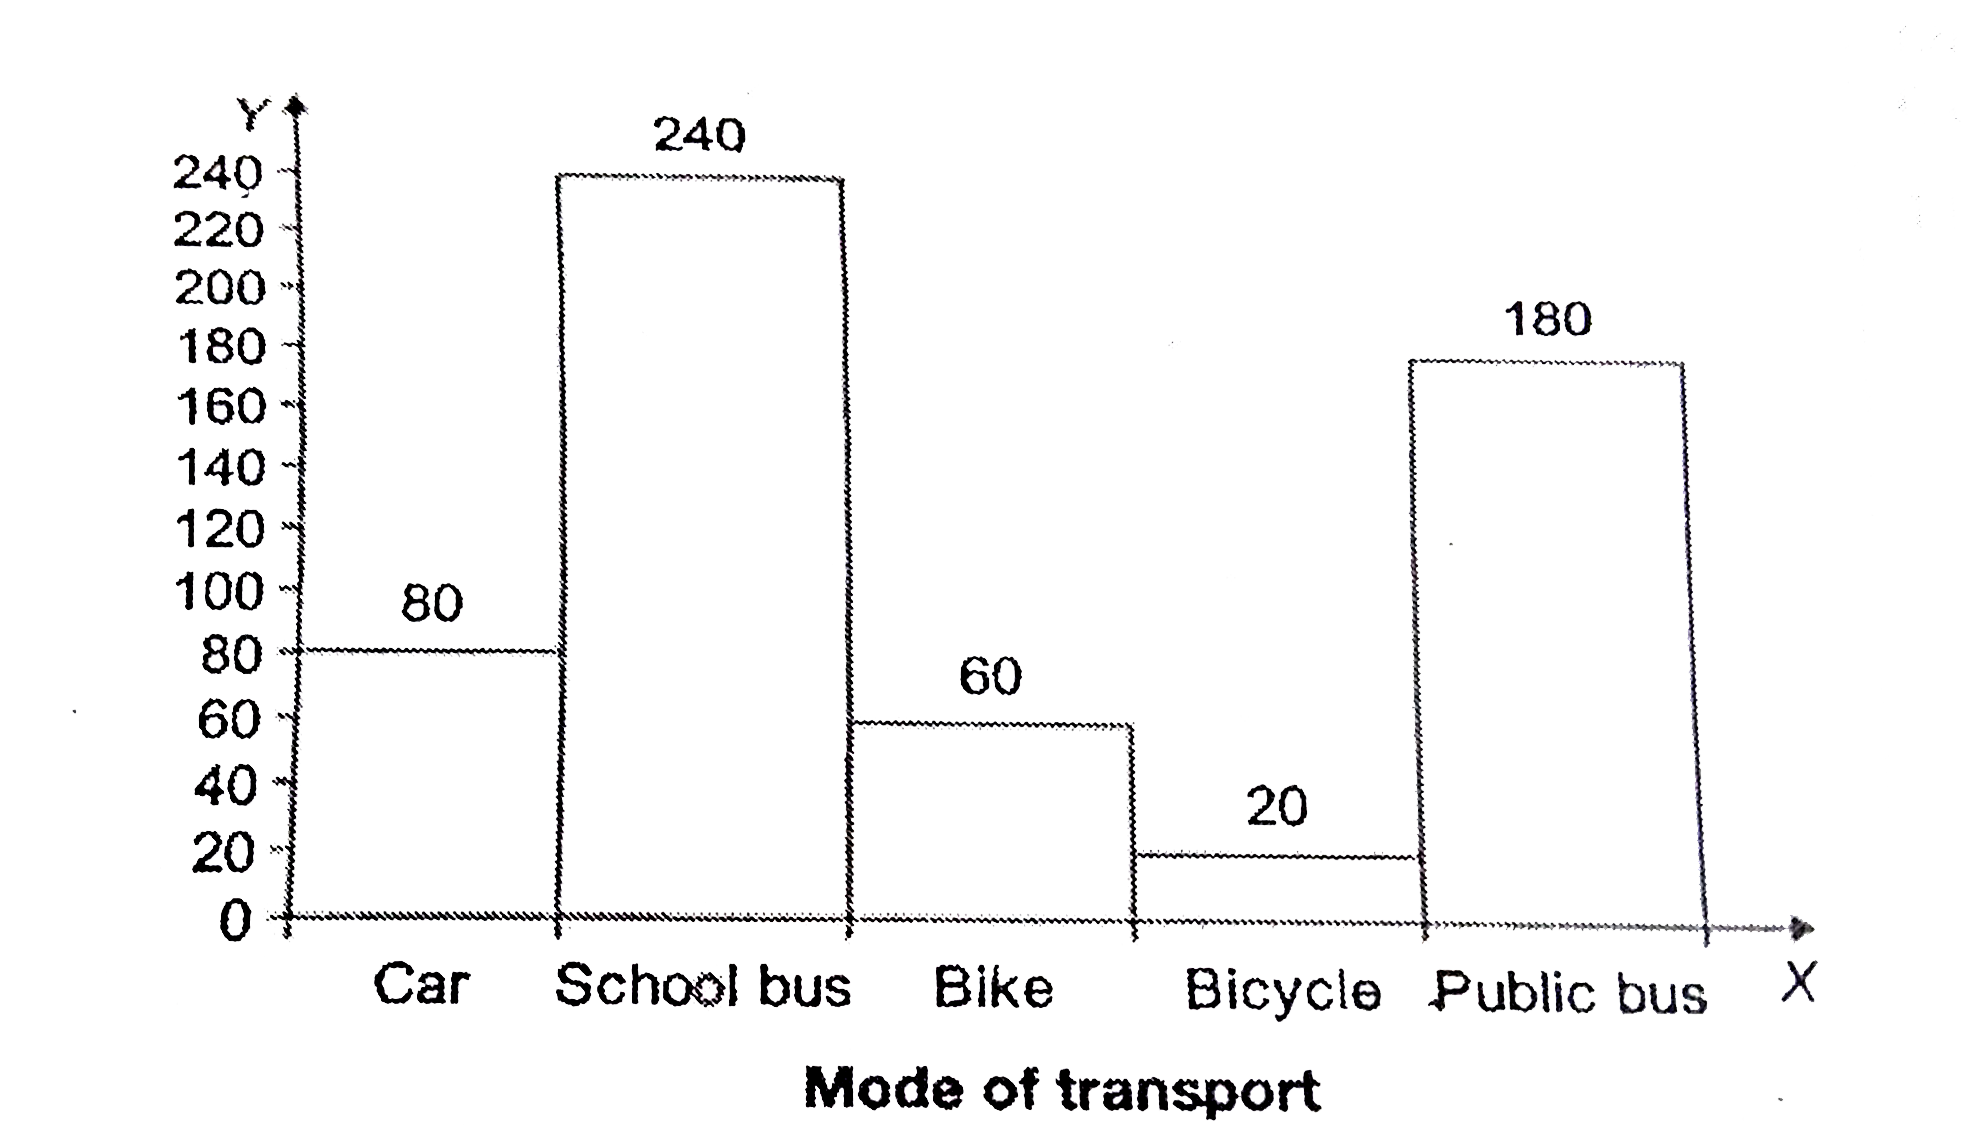
02:40View SolutionThe histogram shows the number of students using different modes of transport to commute from residence to school.

From the bar graph, answer the following question :
What is the total number of pupils who travel by school bus and bike ?01:41View SolutionThe histogram shows the number of students using different modes of transport to commute from residence to school.

From the bar graph, answer the following question :
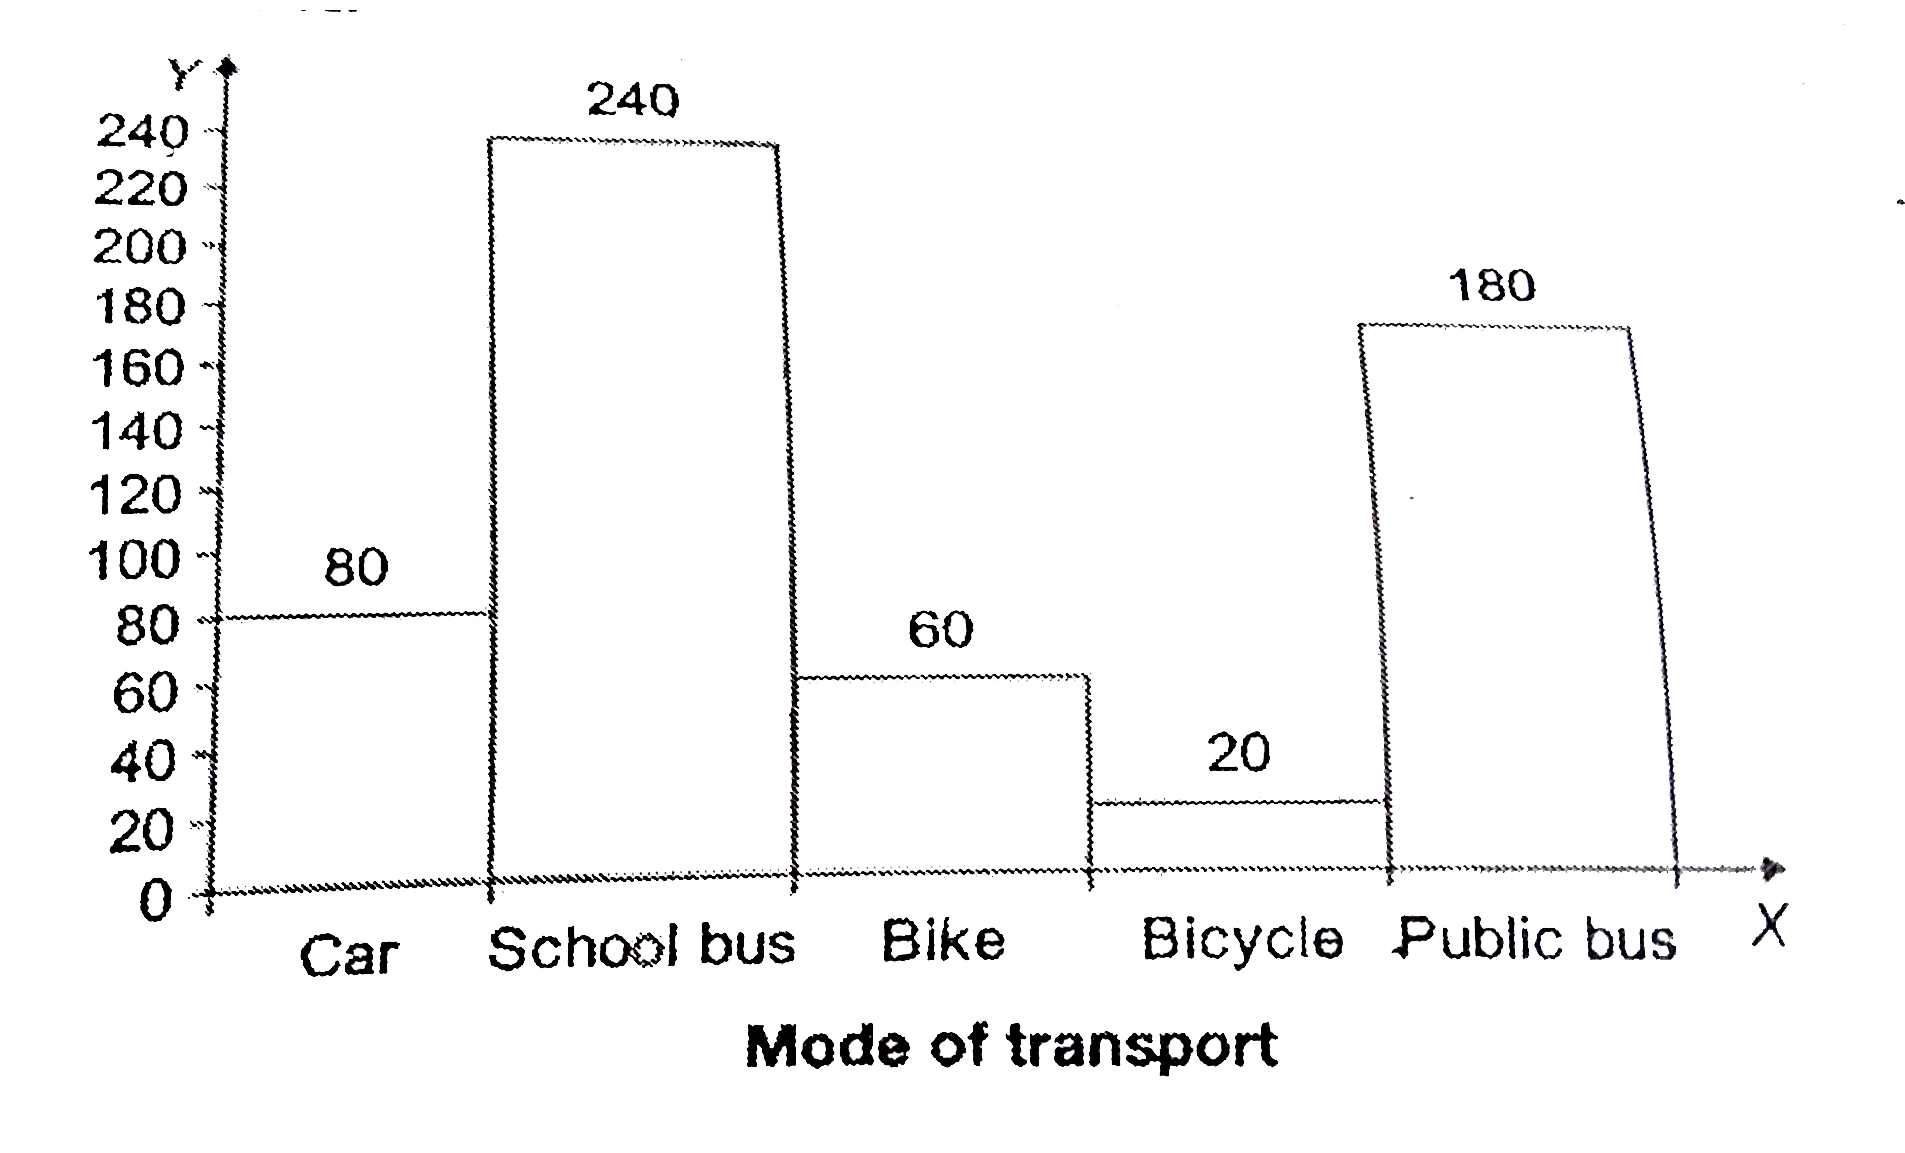
How many more pupils travel by public bus than by car01:28View SolutionThe histogram shows the number of students using different modes of transport to commute from residence to school.

From the bar graph, answer the following question :
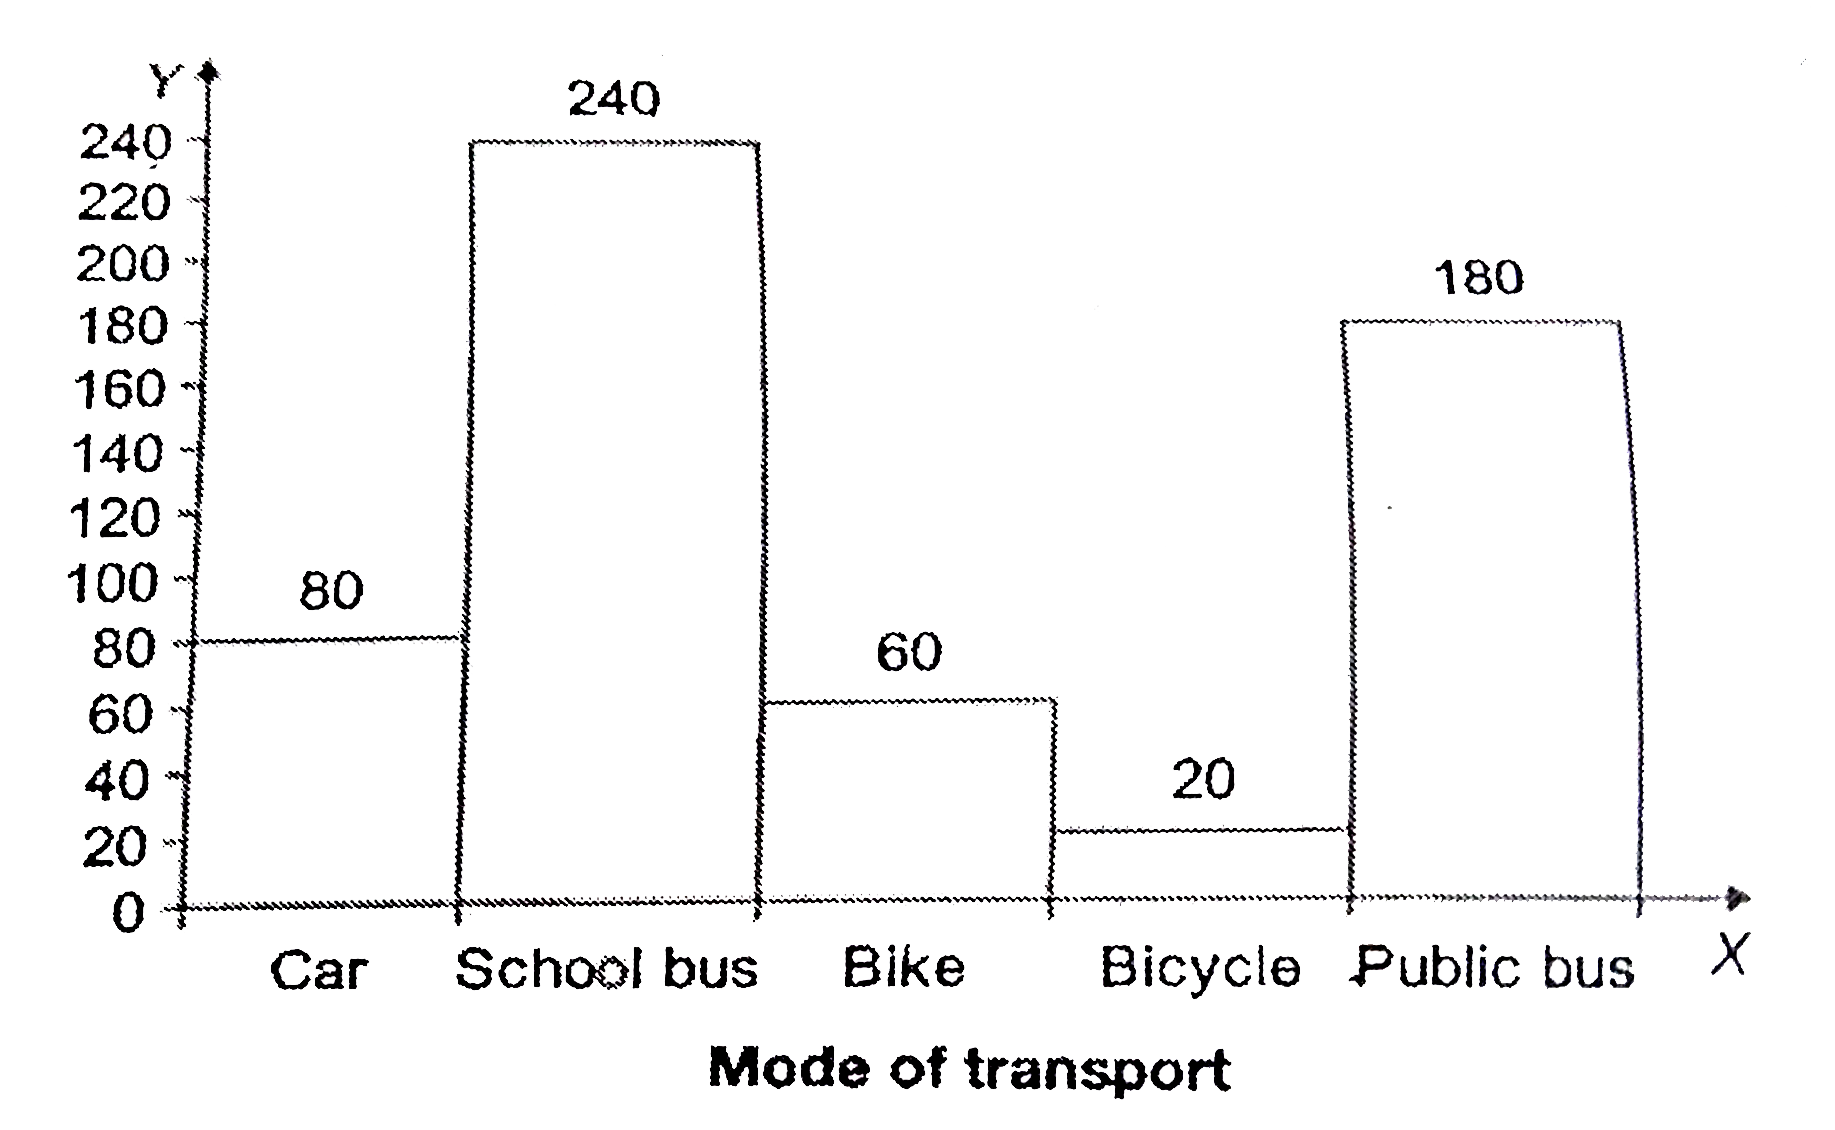
The number of pupils who travel by bike is 3 times than that of the number of pupils who travel by ________ .01:52View SolutionThe histogram shows the number of students using different modes of transport to commute from residence to school.

From the bar graph, answer the following question :
If `6` girls travel to school by bicycle, then how many boys travel by bicycle ?01:27View SolutionThe histogram shows the number of students using different modes of transport to commute from residence to school.

From the bar graph, answer the following question :
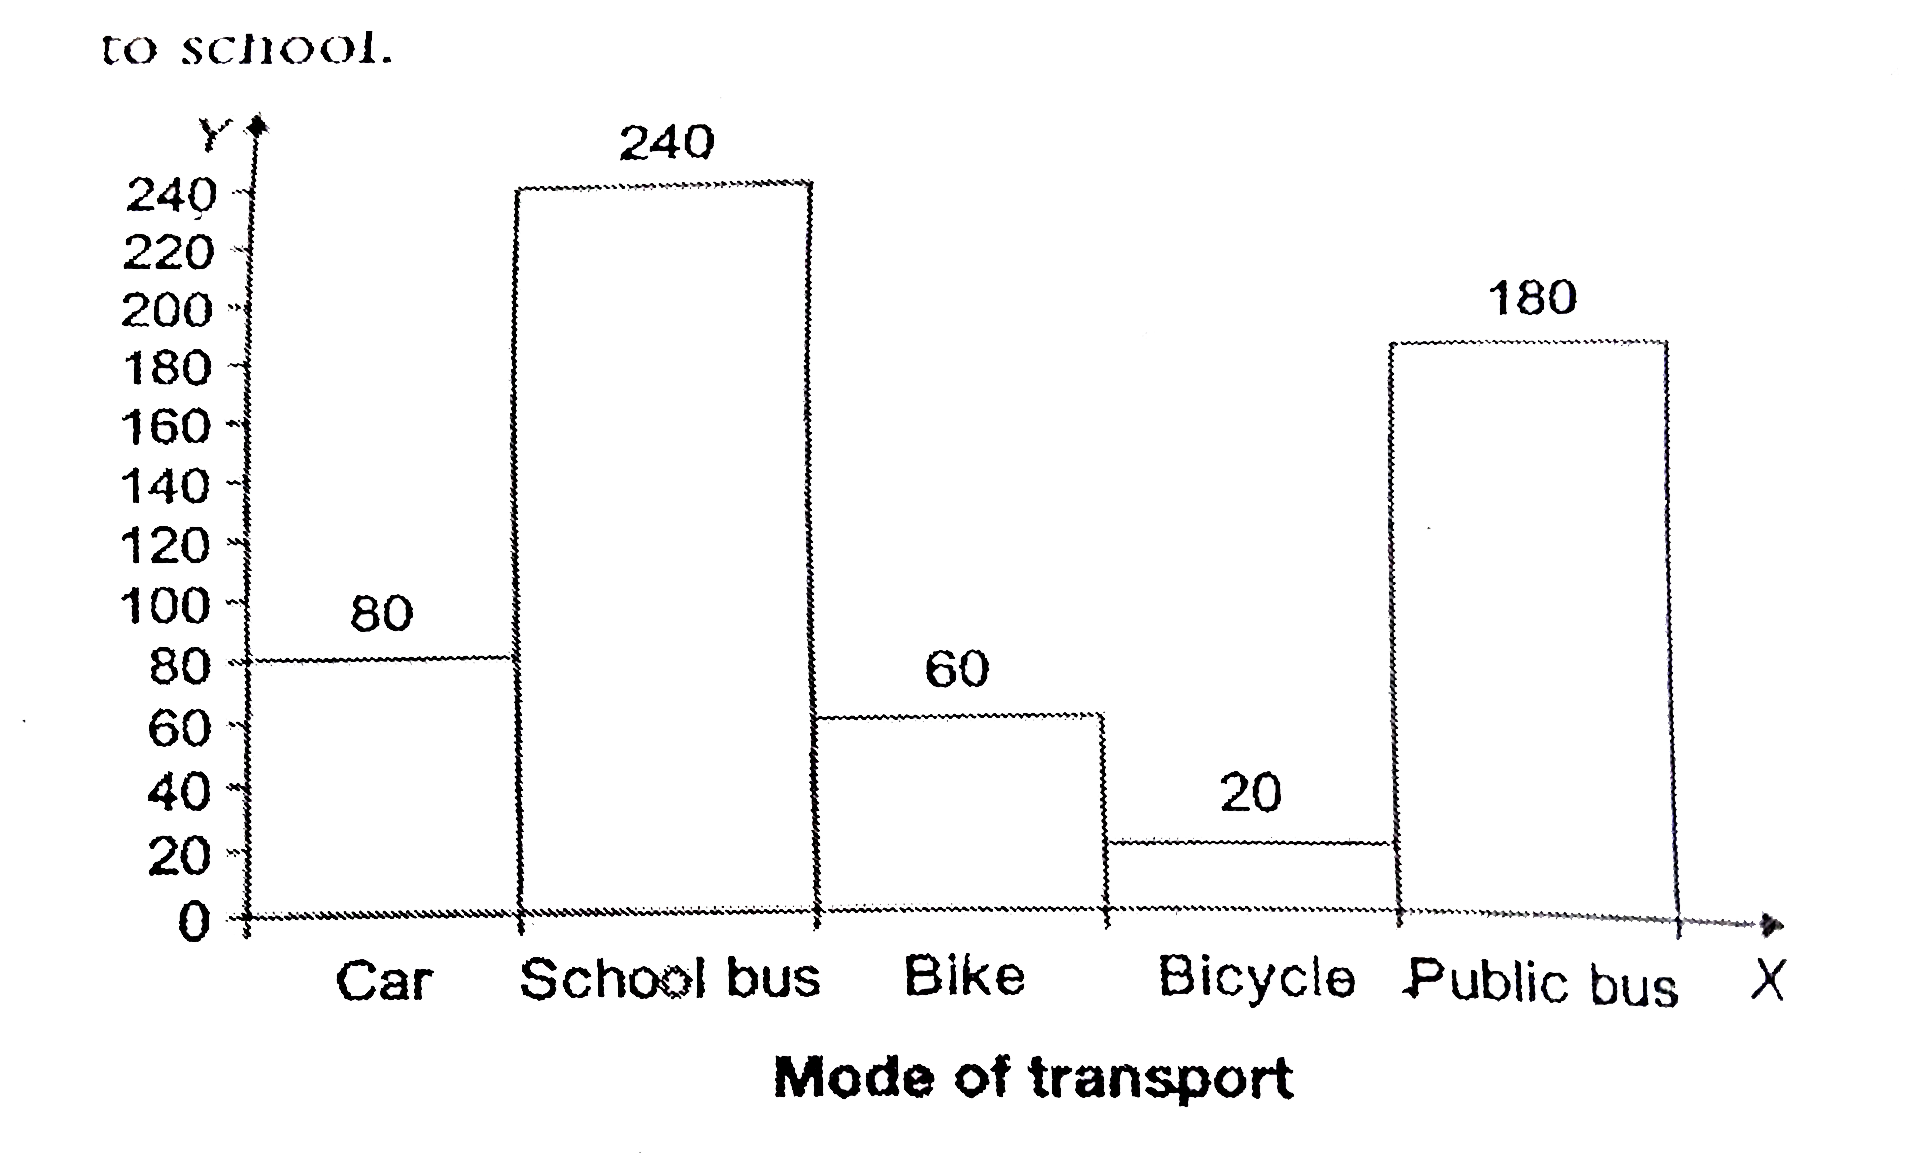
The ratio of the number of pupits who travel by school bus who travel by public bus is __________ .01:53View SolutionFor a given data, Rithik drew a bar graph and Krithik drew a pie chart. By reading both diagrams, they understood that 3 cm is equivalent to `36^(@)`. Column A consists of the length of four bars out of six of the bar graph. Column B conponents of the pie chart.
`{:(,"Column A",,,"Column B"),((a),4cm,(),(p),36^(@)),((b),6.5cm,(),(q),102^(@)),((c),7cm,(),(r),12^(@)),((d),8.5cm,(),(s),84^(@)),(,,,(t),78^(@)),(,,,(u),48^(@)):}`03:51View Solution
TEST YOUR CONCEPTS (VERY SHORT ANSWER TYPE QUESTION ) questions and complete solutions for chapter STATISTICS of PEARSON IIT JEE FOUNDATION of Class 6
