Complete Solutions to SHORT ANSWER TYPE QUESTION of chapter STATISTICS of Class 6 book with complete answers and questions
| Class 6 | MATHS |
| Chapter | STATISTICS |
| PEARSON IIT JEE FOUNDATION | SHORT ANSWER TYPE QUESTION |
| Number Of Questions | 9 |
| Academic Year | 2023-24 |
A bar graph is draph is drawn to the scale of 1cm=k units.
The length of the bar representing 260 units is 5.2 cm. Find the value of k.02:06View SolutionIn a pie chart, a component is represented as a sector with sector angle `108^(@)`, then find the percentage of the value the component totally.
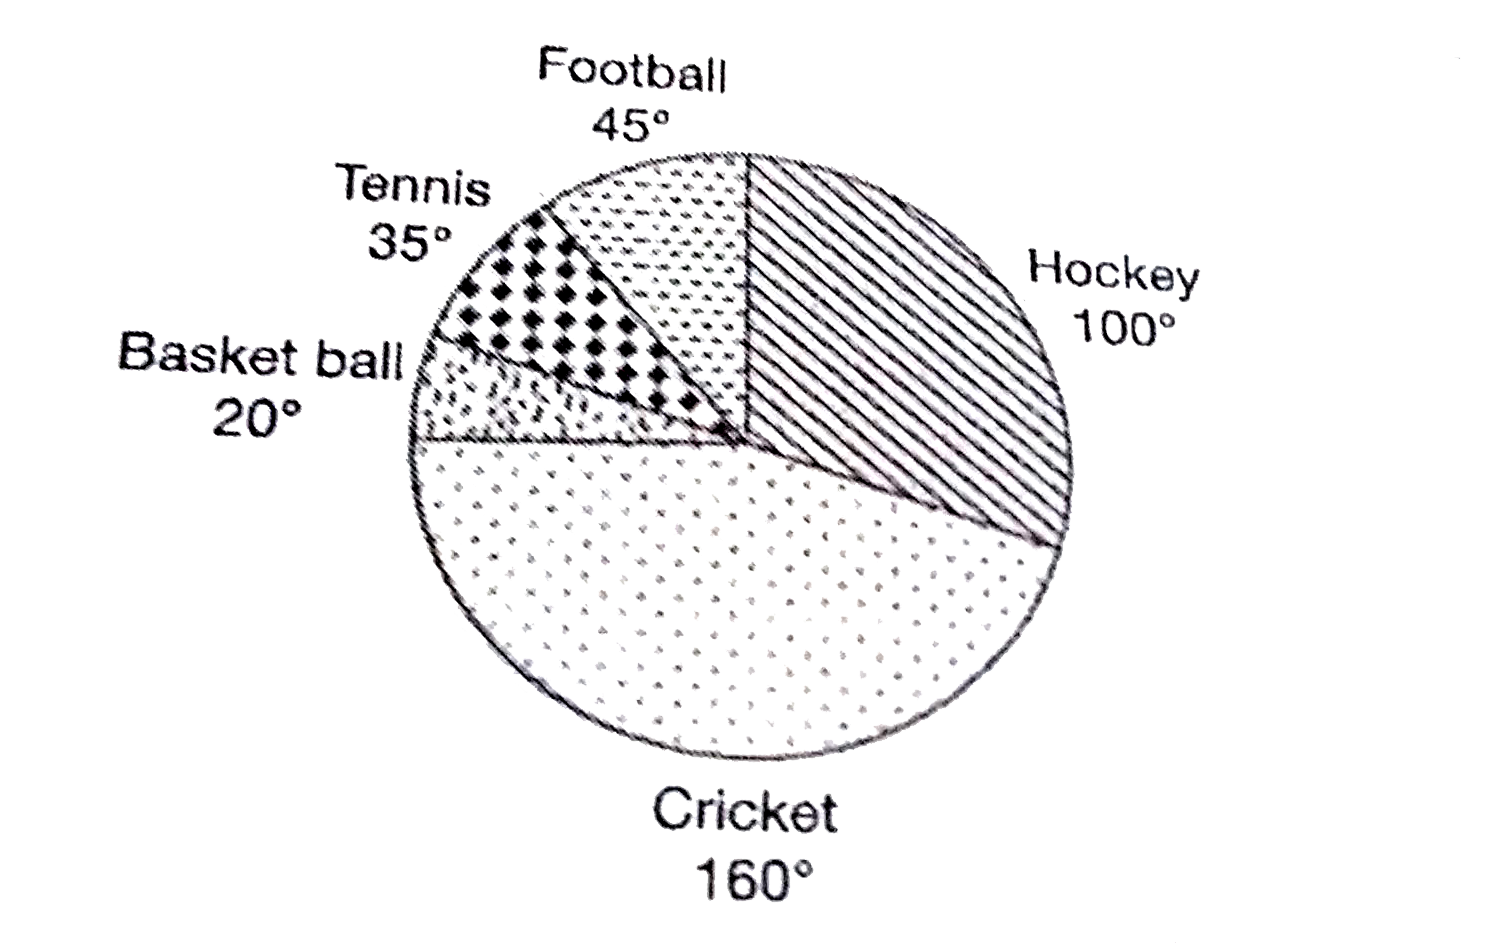
01:49View SolutionThe given pie chart shows the amount of money spent by a school on various sports in the year 2015.

Study the pie chart carefully and answer the following question.
(i) If the amount spent on football was Rs. 9000, then how much more money was spent on hockey than on football ?
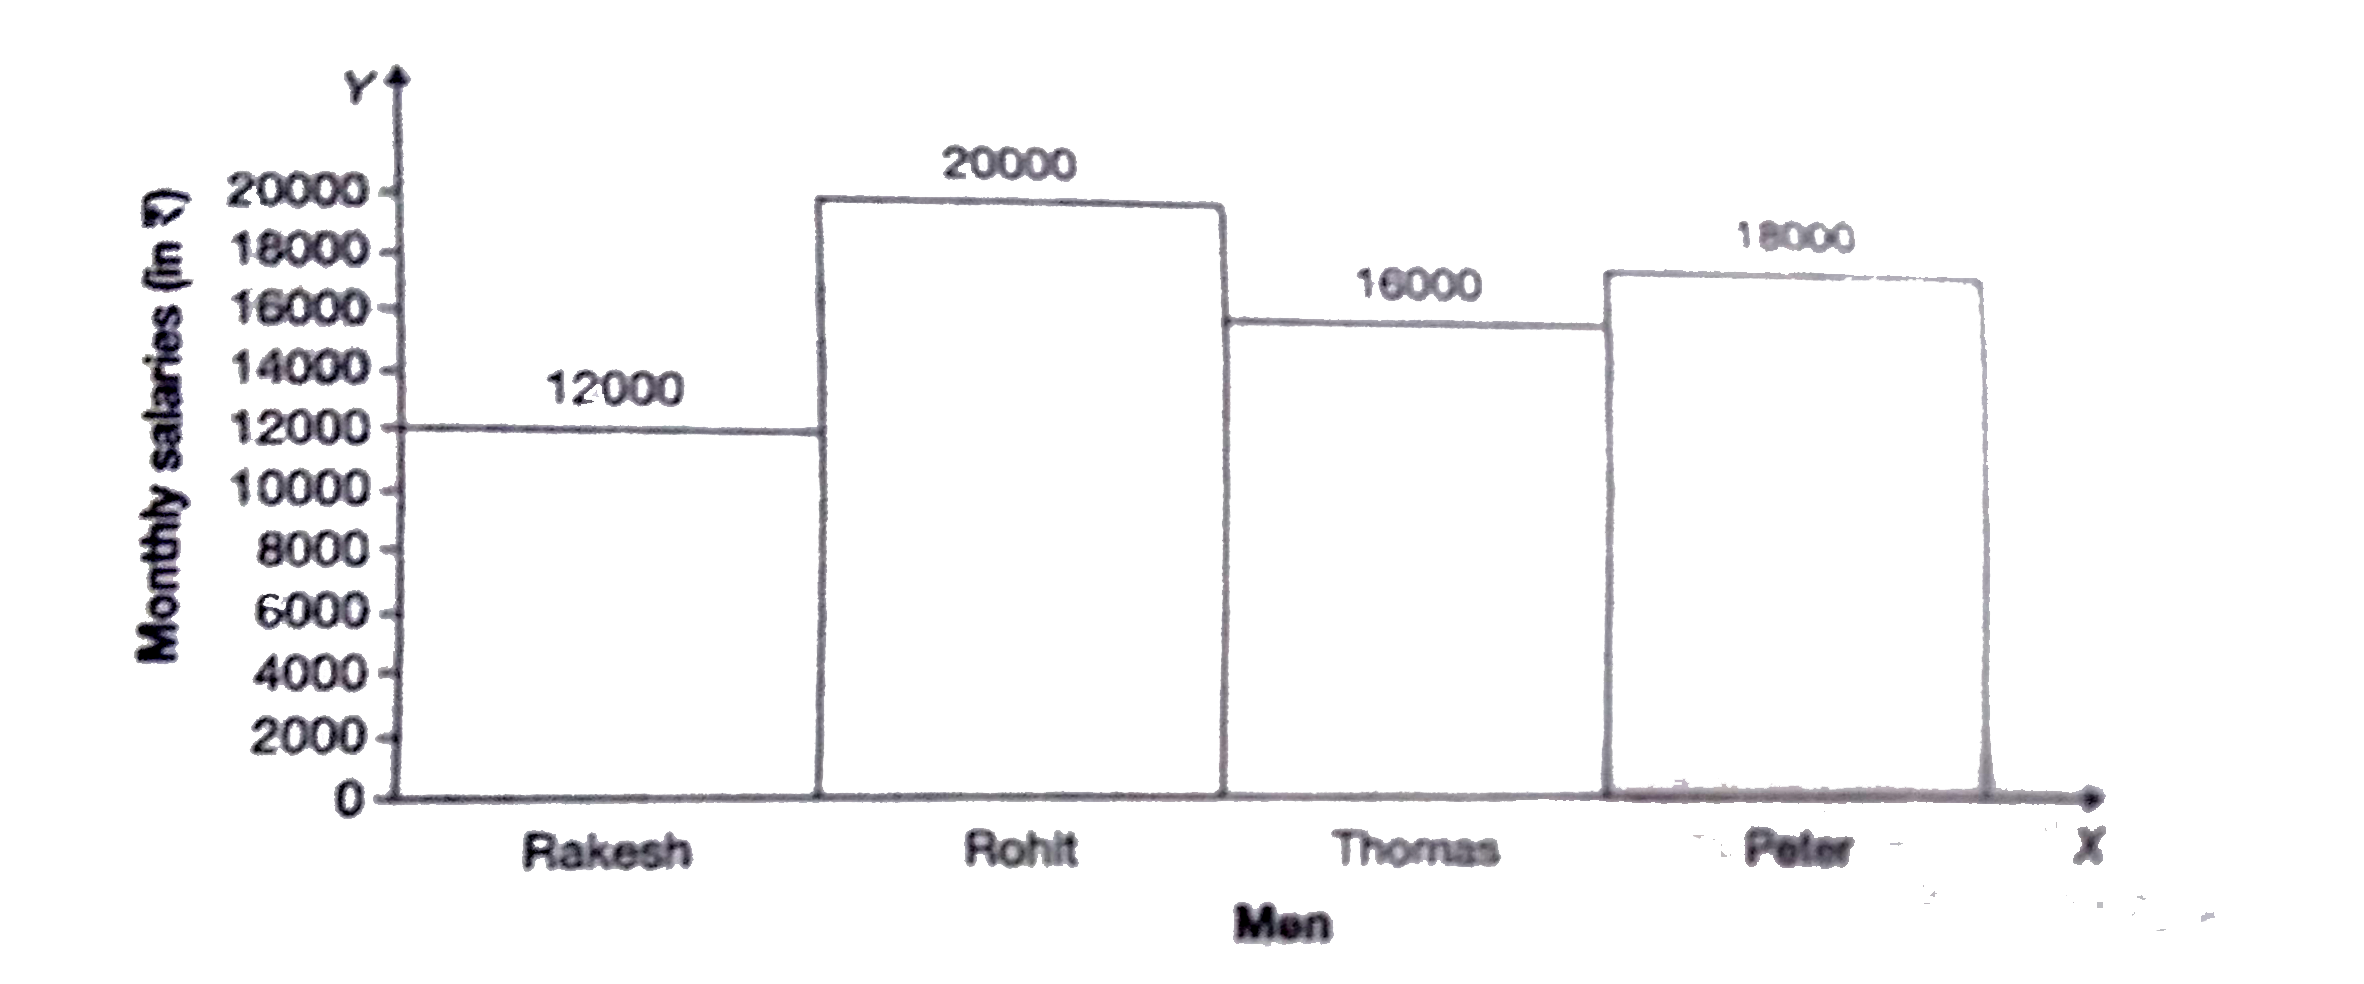
(ii) If the amount spent on football Rs. 9000, then what was the total amount spent on all sports ?04:31View SolutionThe histogram given below shows the monthly salaries of four men. Study the graph carefully and answer the question that follow.

(i) What is the difference between Rohit's and Peter's salaries ?
(ii) If Rakesh spends Rs. 10000 of his salary and saves the rest, how much will save in a year ?
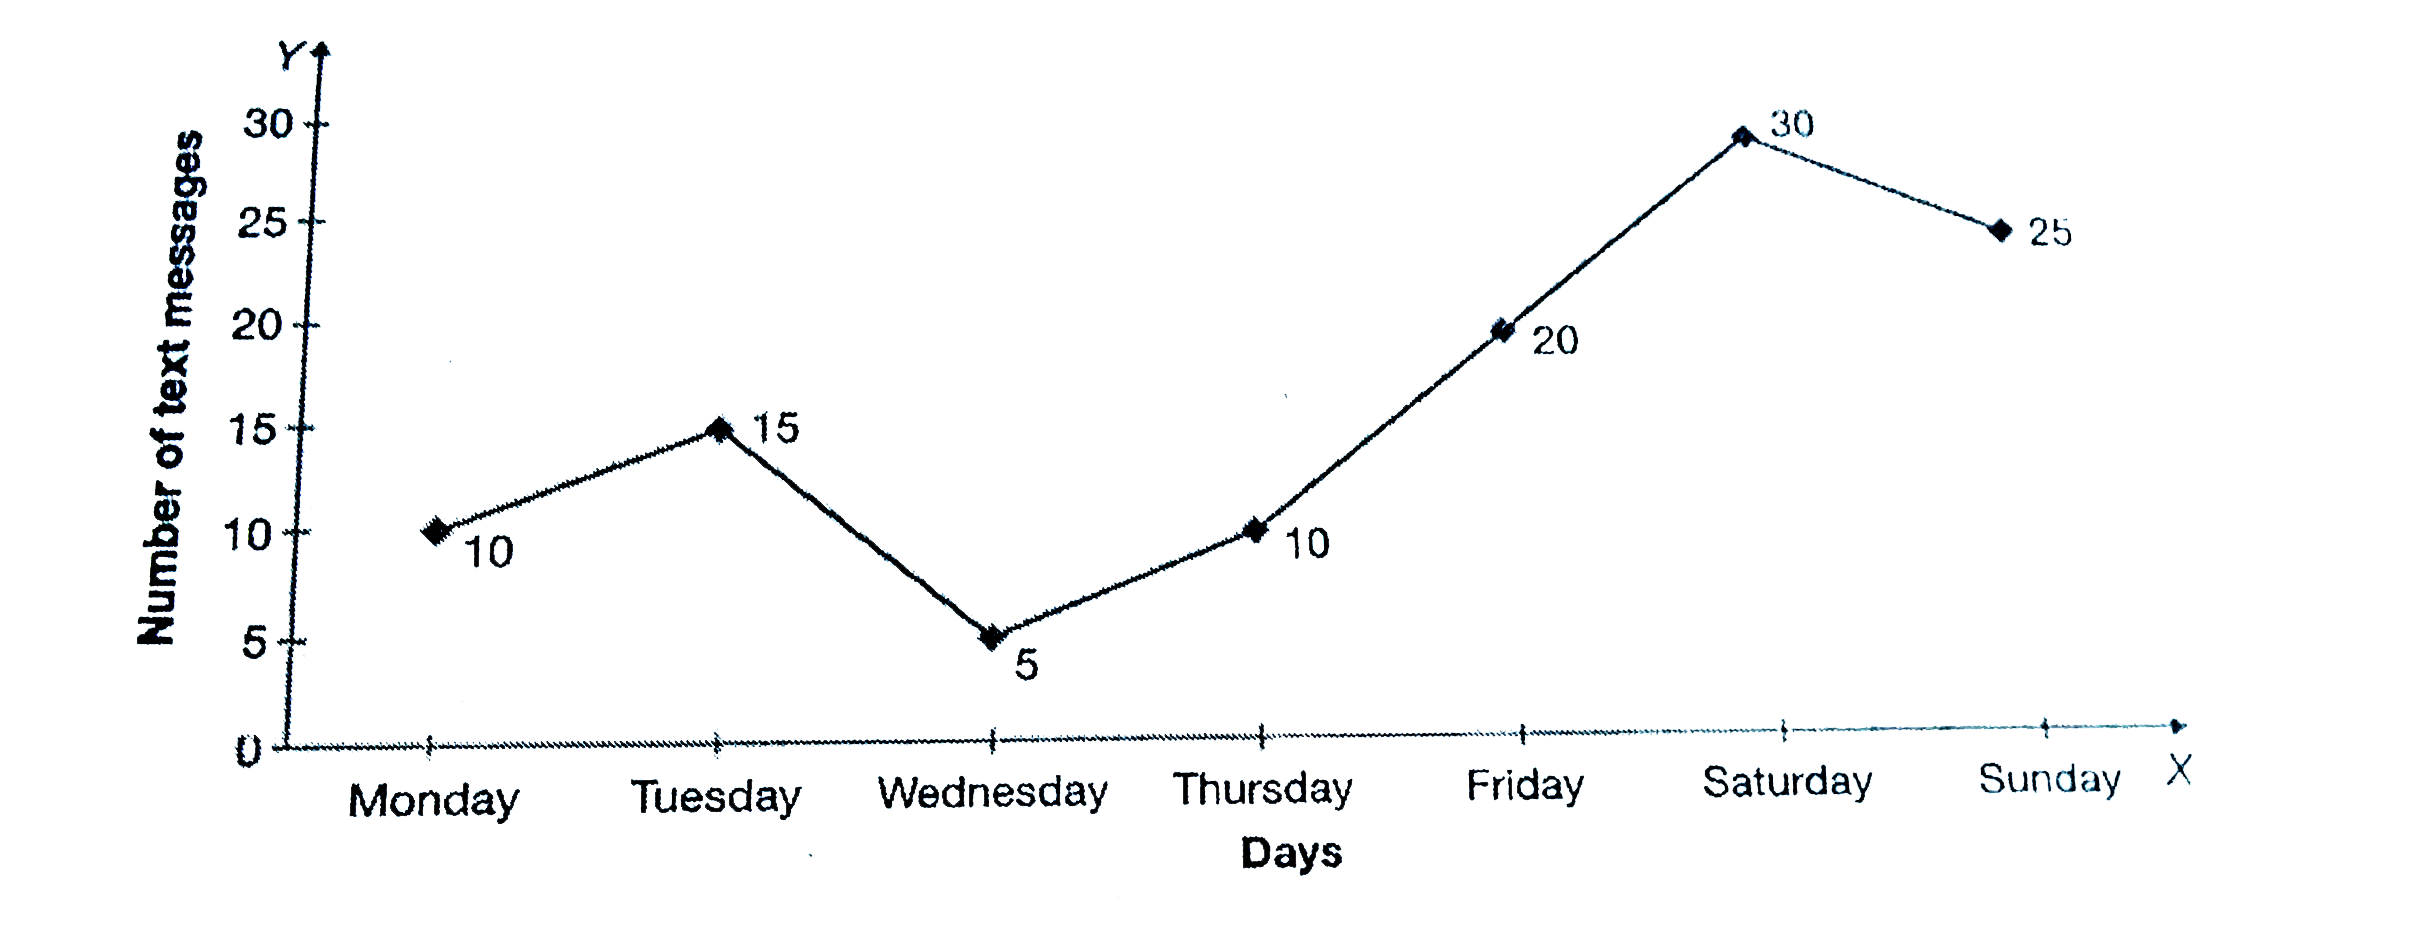
(iii) If Thomas's salary is increased by Rs. 2000, then persons' salary will be equal to that of Thomas ?04:12View SolutionThe line graph given below shows the number of text messages received by Keerthi during a week. Study The graph carefully and answer the questions that follow.

(i) On which day did Keerthi receive exactly 20 text message ?
(iii) Find the total number of text messages received by Keerthi in week.02:14View SolutionThe following table shows the marks secored by a student in annual examination in various subjects. Draw a histogram to represent the given data.
`{:("Subject","Telugu","Hindi","English","Maths","Science","Social Studies"),("Marks",80,74,82,94,90,88):}`02:52View SolutionThe following table shows the household expenditure of family on different items. Draw a pie chart to represent the given data.
`{:("Item","Rent","Food","Cloting","Education","Others"),("Expenditure",25%,30%,10%,15%,20%):}`05:39View SolutionThe following table shows the number of toys sold by a mart during a week. Draw a line graph to represent the given data.
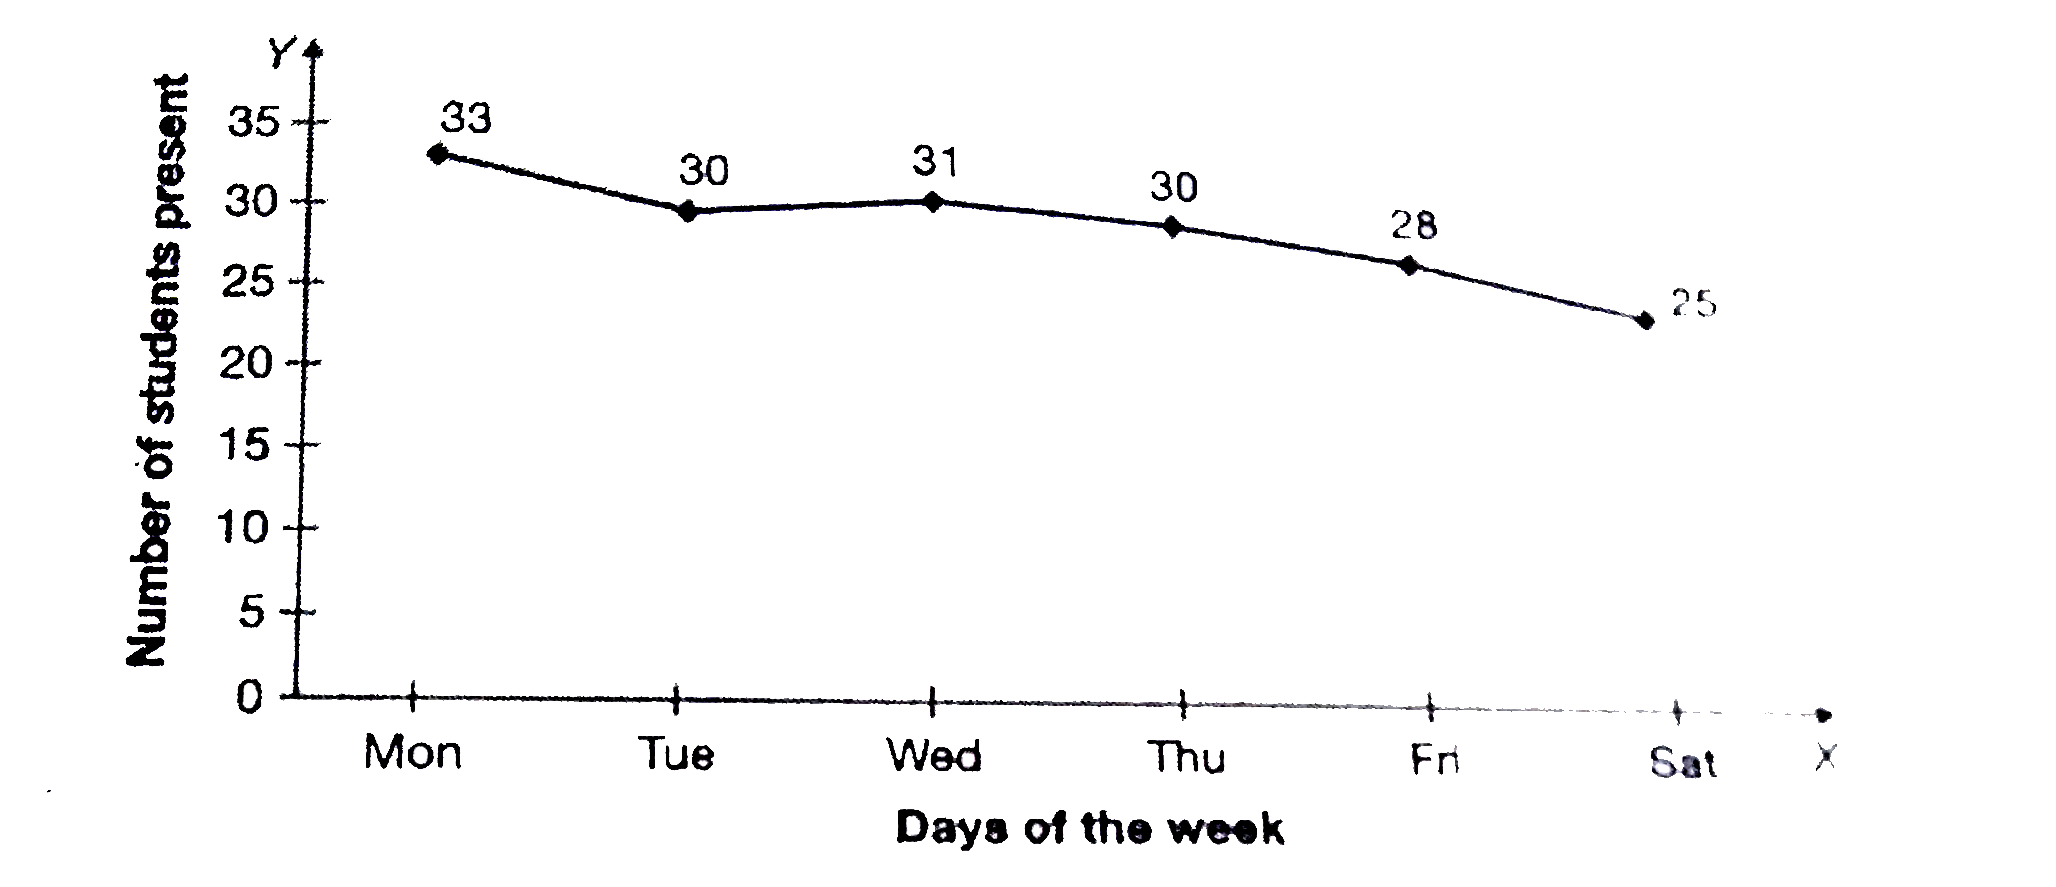
`{:("Week","Mon","Tue","Wed","Thurs","Fri","Sat","Sun"),("Number of Toys",21,10,17,24,10,16,20):}`03:19View SolutionThe line graph shows the attendance of 35 students over a week.

(i) On which day of the week was more number of student present ?
(ii) If 18 boys were present on Thursday, then how many girls were present on the same day ?01:36View Solution
SHORT ANSWER TYPE QUESTION questions and complete solutions for chapter STATISTICS of PEARSON IIT JEE FOUNDATION of Class 6
