Complete Solutions to EXAMPLES of chapter DATA HANDLING of Class 7 book with complete answers and questions
| Class 7 | MATHS |
| Chapter | DATA HANDLING |
| NCERT EXEMPLAR | EXAMPLES |
| Number Of Questions | 9 |
| Academic Year | 2023-24 |
Find the median of the data:
3, 11, 7, 2, 5, 9, 9, 2, 10, 15, 7
View SolutionFind the median of the data :
21, 15, 6, 25, 18, 13, 20, 9, 8, 12
View SolutionThe cards bearing letters of the word "MATHEMATICS" are placed in a bag. A card is taken out from the bag without looking into the bag (at random).
(a) How many outcomes are possible when a letter is taken out of the bag at random?
(b) What is the probability of getting
(i) M?
(ii) Any vowel?
(iii) Any consonant?
(iv) X?
View SolutionIf the mean of 26, 28, 25, x, 24 is 27, find the value of x
View SolutionThe mean of 10 observations was calculated as 40. It was detected on rechecking that the value of 45 was wrongly copied as 15. Find the correct mean.
View SolutionThe median of observations 11, 12, 14, 18, x+ 2, 20, 22, 25, 61 arranged in ascending order is 21. Find the value of x.
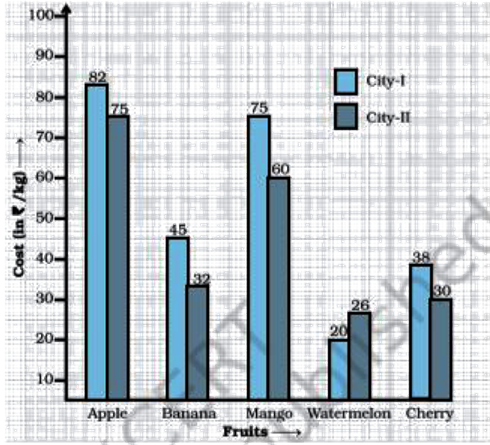
View SolutionStudy the double bar graph given below and answer the questions that follow:

(a) What information does the above double graph depict?
(b) Name the fruits for which cost of 1 kg is greater in City I as compared to City II.
(c) What is the difference of rates for apples in both the cities?
(d) Find the ratio of the cost of mangoes per kg in City I to the cost of mangoes per kg in City II.
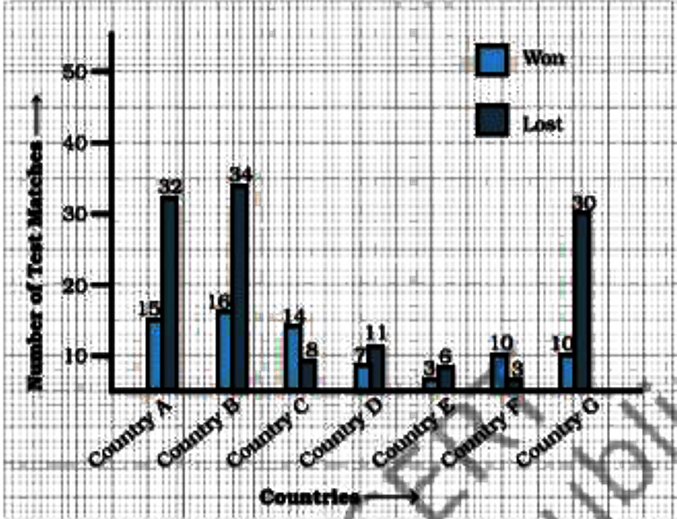
View SolutionThe following double bar graph represents test matches results summary for Cricket Team of country X against different countries:

Use the bar graph to answer the following questions:
(a) Which country has managed maximum wins against country X?
(b) The difference between the number of matches won and lost is highest for which country against country X?
(c) Number of wins of country E is the same as number of losses of which country against country X?
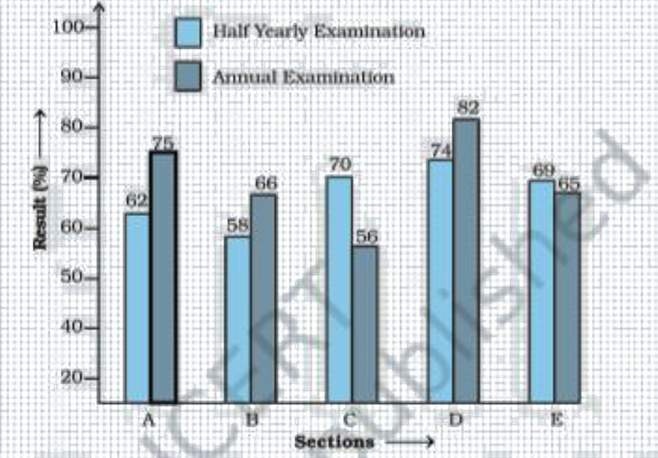
View SolutionThe double bar graph given below compares the class-averages in half yearly and annual examinations of 5 sections of Class VII.

Observe the graph carefully and tell which section showed the most improvement and by how much?
View Solution
EXAMPLES questions and complete solutions for chapter DATA HANDLING of NCERT EXEMPLAR of Class 7