Complete Solutions to THINK AND DISCUSS of chapter DATA HANDLING of Class 7 book with complete answers and questions
| Class 7 | MATHS |
| Chapter | DATA HANDLING |
| NCERT EXEMPLAR | THINK AND DISCUSS |
| Number Of Questions | 3 |
| Academic Year | 2023-24 |
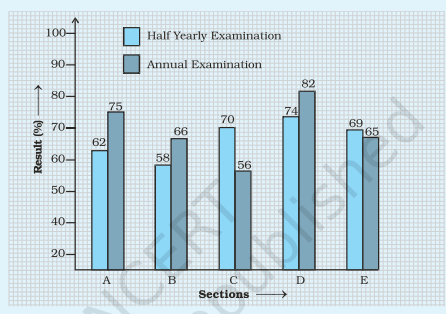
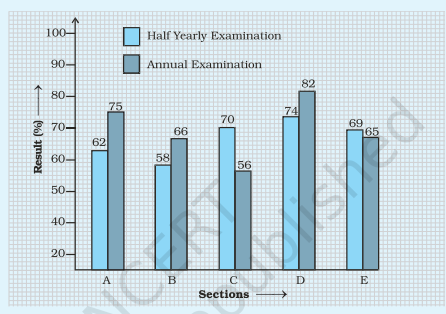
The double bar graph given below compares the class-averages in half yearly and annual examinations of 5 sections of Class VII.

Can you compare the ratio of difference of results of sections B and D ?
View Solution
From the graph can you observe the sections where there war no improvement ?
View SolutionWhat is the difference between a bar graph and a histogram
View Solution
THINK AND DISCUSS questions and complete solutions for chapter DATA HANDLING of NCERT EXEMPLAR of Class 7