Complete Solutions to ADDITIONAL QUESTIONS FOR PRACTICE (Short Answer Type Questions) of chapter DATA HANDLING of Class 8 book with complete answers and questions
| Class 8 | MATHS |
| Chapter | DATA HANDLING |
| NAND LAL PUBLICATION | ADDITIONAL QUESTIONS FOR PRACTICE (Short Answer Type Questions) |
| Number Of Questions | 2 |
| Academic Year | 2023-24 |
Following are the numbers of members in 25 familles of a village 7, 9, 8, 8, 7, 6, 4, 3, 7, 9, 8, 8, 5, 4, 7, 7, 7, 8, 6, 5, 4, 4, 3, 6, 5
Prepare a frequency distribution table for the data using class intervals 0-3, 3-6............so on.
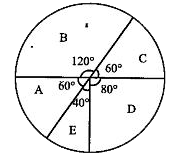
View SolutionThe pie chart gives the information of the number of votes obtained by five schools leaders, who contested for school elections. The total votes polled were 540.

(a) Who won the elections?
(b) By how many votes did the winner defeat the nearest rival?
(c ) Who got the least number of votes?
View Solution
ADDITIONAL QUESTIONS FOR PRACTICE (Short Answer Type Questions) questions and complete solutions for chapter DATA HANDLING of NAND LAL PUBLICATION of Class 8
All Exercises from NAND LAL PUBLICATION Class 8 MATHS DATA HANDLING
- ADDITIONAL QUESTIONS FOR PRACTICE (Long Answer Type Questions)
- ADDITIONAL QUESTIONS FOR PRACTICE (Objective Type Questions)
- ADDITIONAL QUESTIONS FOR PRACTICE (Short Answer Type Questions)
- EXERCISE-5.1
- EXERCISE-5.2
- EXERCISE-5.3
- Question
- SAMPLE PAPER FOR PRACTICE
- SAMPLE PAPER FOR PRACTICE (Answer the multiple choice question)
- SAMPLE PAPER FOR PRACTICE (Fill in the blanks)
- Think, Discuss and Write
- Try these