Complete Solutions to EXERCISE-5.1 of chapter DATA HANDLING of Class 8 book with complete answers and questions
| Class 8 | MATHS |
| Chapter | DATA HANDLING |
| NAND LAL PUBLICATION | EXERCISE-5.1 |
| Number Of Questions | 2 |
| Academic Year | 2023-24 |
For which of these would you use a histogram to show the data : The number of letters for different areas in a postman’s bag. Give reasons for each
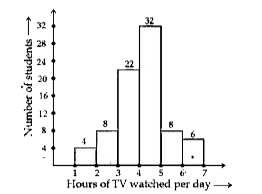
View SolutionThe number of hours for which students of a particular class watched television during holidays is shown through the given graph. Answer the following:
(i) For how many hours did the maximum number of students watch TV?
(ii) How many students watched TV for less than 4 hours?
(iii) How many students spent more than 5 hours in watching TV?

View Solution
EXERCISE-5.1 questions and complete solutions for chapter DATA HANDLING of NAND LAL PUBLICATION of Class 8
All Exercises from NAND LAL PUBLICATION Class 8 MATHS DATA HANDLING
- ADDITIONAL QUESTIONS FOR PRACTICE (Long Answer Type Questions)
- ADDITIONAL QUESTIONS FOR PRACTICE (Objective Type Questions)
- ADDITIONAL QUESTIONS FOR PRACTICE (Short Answer Type Questions)
- EXERCISE-5.1
- EXERCISE-5.2
- EXERCISE-5.3
- Question
- SAMPLE PAPER FOR PRACTICE
- SAMPLE PAPER FOR PRACTICE (Answer the multiple choice question)
- SAMPLE PAPER FOR PRACTICE (Fill in the blanks)
- Think, Discuss and Write
- Try these