Complete Solutions to EXERCISE (True or False) of chapter DATA HANDLING of Class 8 book with complete answers and questions
| Class 8 | MATHS |
| Chapter | DATA HANDLING |
| NCERT EXEMPLAR | EXERCISE (True or False) |
| Number Of Questions | 23 |
| Academic Year | 2023-24 |
A type of graph in which a circle is divided into sectors such that each sector represents a proption of the whole is a
View SolutionThe central angle of a component in a pie chart is _______.
View SolutionThe central angle of a component in a pie chart is _______.
View SolutionIn a pie chart two central angles can be of `180^@`.
View SolutionIn a pie chart two or more central angles can be equal.
View SolutionThe probability of getting a prime number when a die is thrown once is `(2)/(3)`.
View Solution`{:("Marks (obtained out of 10)", 4,5,7,8,9,10),("Frequency",5,10,8,6,12,9):}`
9 students got full marks. ??
View Solution`{:("Marks (obtained out of 10)", 4,5,7,8,9,10),("Frequency",5,10,8,6,12,9):}`
The frequency of less than 8 marks is 29. ??
View Solution`{:("Marks (obtained out of 10)", 4,5,7,8,9,10),("Frequency",5,10,8,6,12,9):}`
The frequency of more than 8 marks is 21.
View Solution`{:("Marks (obtained out of 10)", 4,5,7,8,9,10),("Frequency",5,10,8,6,12,9):}`
10 marks the highest frequency.
View SolutionIf the fifth class interval is 60 - 65, fourth class interval is 55 - 60, then the first class interval is 45-50.
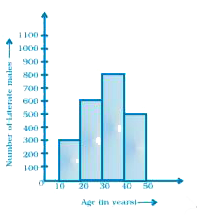
View SolutionFrom the histogram given on the right, we can say that 1500 males above the age of 20 are literate.

View SolutionThe class size of the class interval 60 - 68 is
View SolutionIf coin is tossed twice, then the number of possible outcomes is ...............
View SolutionA die is thrown once. The probability of getting an even numbers is
View SolutionOn throwing a dice once, the probability of occurence of a composite number is `1/2`. True or false.
View SolutionIf there are 15 balls in a bag with 6 red, 4 white and 5 yellow, then the probability of drawing a yellow ball is.
View SolutionSet of all possible outcomes of an experiment is called its
View SolutionThe probability of getting number 6 in a throw of a dice is `1/6`. Similarly the probability of getting a number 5 is `1/5`. True or false.
View SolutionThe probability of getting a prime number is the same as that of a composite number in a throw of a dice. True or false.
View SolutionIf an unbiased dice is rolled, then the probability of getting an even number is _______ then/to that of getting an odd number.
View SolutionRandom experiment
View SolutionState True or False:
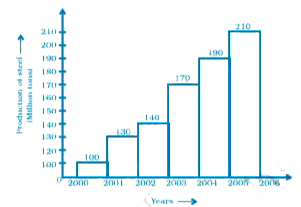
The following pictorial representation of data is a histogram.

View Solution
EXERCISE (True or False) questions and complete solutions for chapter DATA HANDLING of NCERT EXEMPLAR of Class 8