Complete Solutions to EXERCISE of chapter DATA HANDLING of Class 8 book with complete answers and questions
| Class 8 | MATHS |
| Chapter | DATA HANDLING |
| NCERT EXEMPLAR | EXERCISE |
| Number Of Questions | 73 |
| Academic Year | 2023-24 |
Given below is a frequency distribution table. Read it and answer the questions that follow:
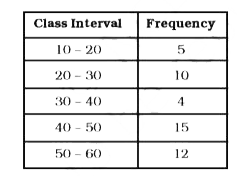
What is the lower limit of the second class interval?
View SolutionGiven below is a frequency distribution table. Read it and answer the questions that follow:
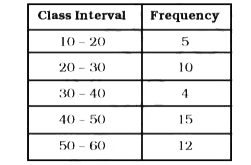
What is the upper limit of the last class interval?
View SolutionGiven below is a frequency distribution table. Read it and answer the questions that follow:
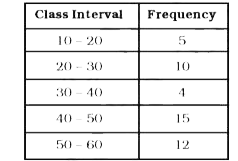
What is the frequency of the third class?
View SolutionGiven below is a frequency distribution table. Read it and answer the questions that follow:
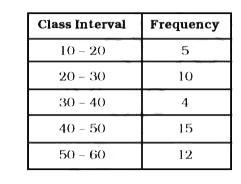
Which interval has a frequency of 10?
View SolutionGiven below is a frequency distribution table. Read it and answer the questions that follow:
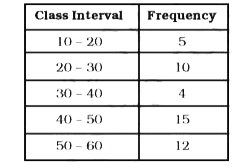
Which interval has the lowest frequency?
View SolutionGiven below is a frequency distribution table. Read it and answer the questions that follow:
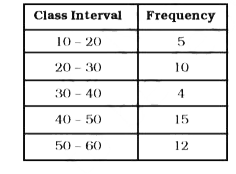
What is the class size?
View SolutionThe top speeds of 30 different land animals have been organised into a frequency table given below:

Draw a histogram for the given data.
View SolutionGiven below is a pie chart showing the time spend by a group of 350 children in different games. Observe it and answer the questions that follow.
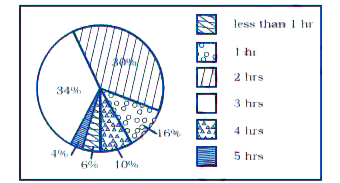
How many children spend at least one hour in playing games?
View SolutionGiven below is a pie chart showing the time spend by a group of 350 children in different games. Observe it and answer the questions that follow.
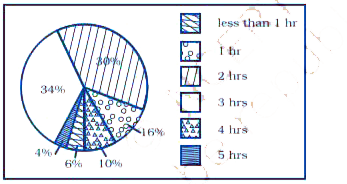
How many children spend more than 2 hours in playing games?
View SolutionGiven below is a pie chart showing the time spend by a group of 350 children in different games. Observe it and answer the questions that follow.
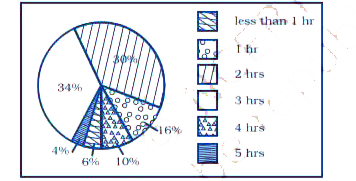
How many children spend 3 or lesser hours in playing games?
View SolutionGiven below is a pie chart showing the time spend by a group of 350 children in different games. Observe it and answer the questions that follow.
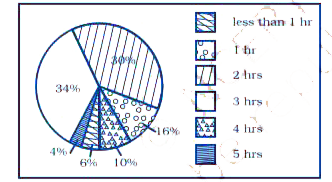
Which is greater — number of children who spend 2 hours or more per day or number of children who play for less than one hour?
View SolutionThe pie chart on the right shows the result of a survey carried out to find the modes of travel used by the children to go to school. Study the pie chart and answer the questions that follow.
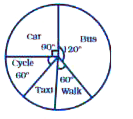
What is the most common mode of transport?
View SolutionThe pie chart on the right shows the result of a survey carried out to find the modes of travel used by the children to go to school. Study the pie chart and answer the questions that follow.
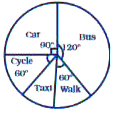
What fraction of children travel by car?
View SolutionThe pie chart on the right shows the result of a survey carried out to find the modes of travel used by the children to go to school. Study the pie chart and answer the questions that follow.
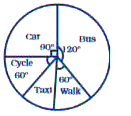
If 18 children travel by car, how many children took part in the survey?
View SolutionThe pie chart on the right shows the result of a survey carried out to find the modes of travel used by the children to go to school. Study the pie chart and answer the questions that follow.
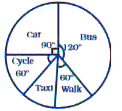
If 18 children travel by car, How many children use taxi to travel to school?
View SolutionThe pie chart on the right shows the result of a survey carried out to find the modes of travel used by the children to go to school. Study the pie chart and answer the questions that follow.
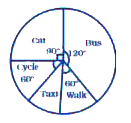
By which two modes of transport are equal number of children travelling?
View Solution4 A dice is thrown once, then the probability of getting an odd prime number is
View SolutionA dice is rolled once. What is the probability that the number on top will be
Greater than 5
View SolutionIn a throw of a dice, find the probability of:
(i) getting a multiple of 3
(ii) getting a number which is not a multiple of 3.
View SolutionA dice is rolled once. What is the probability that the number on top will be
Less than 1
View SolutionA dice is rolled once. What is the probability that the number on top will be
A factor of 36
View SolutionA dice is rolled once. What is the probability that the number on top will be
A factor of 6
View SolutionClassify the following statements under appropriate headings.
(a) Getting the sum of angles of a triangle as `180^@`.
(b) India winning a cricket match against Pakistan.
(c) Sun setting in the evening.
(d) Getting 7 when a die is thrown.
(e) Sun rising from the west.
(f) Winning a racing competition by you.

View SolutionStudy the pie chart given below depicting the marks scored by a student in an examination out of 540. Find the marks obtained by him in each subject.
View SolutionA bag contains white and yellow balls. The probability of choosing a white ball is `2/9`. If the total number of balls in the bag is 36, then number of yellow balls is.
View SolutionLook at the histogram below and answer the questions that follow.
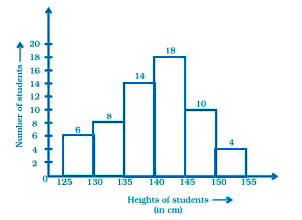
How many students have height more than or equal to 135 cm but less than 150 cm?
View SolutionLook at the histogram below and answer the questions that follow.
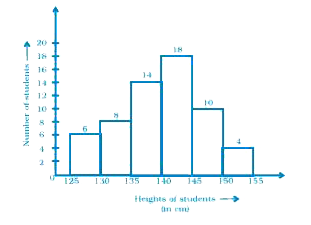
Which class interval has the least number of students?
View SolutionLook at the histogram below and answer the questions that follow.
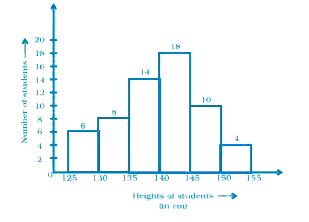
What is the class size?
View SolutionLook at the histogram below and answer the questions that follow.
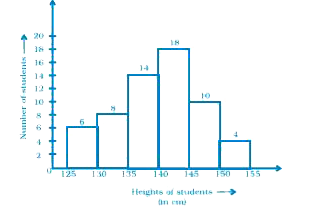
How many students have height less than 140 cm?
View SolutionFollowing are the number of members in 25 families of a village:
6, 8, 7, 7, 6, 5, 3, 2, 5, 6, 8, 7, 7, 4, 3, 6, 6, 6, 7, 5, 4, 3, 3, 2, 5.
Prepare a frequency distribution table for the data using class intervals 0-2, 2-4, etc.
View SolutionThe marks obtained (out of 20) by 30 students of a class in a test are as follows:
14, 16, 15, 11, 15, 14, 13, 16, 8, 10, 7, 11, 18, 15, 14, 19, 20, 7, 10, 13, 12, 14, 15, 13, 16, 17, 14, 11, 10, 20.
Prepare a frequency distribution table for the above data using class intervals of equal width in which one class interval is 4-8 (excluding 8 and including 4).
View SolutionThe weights (in kg) of 30 students of a class are
39,43,32,37,29,26,31,45, 46,31,37,38,30,39,36,41,35,34,41,46,39,38,36,38,40,42,33,43,44,33.
Prepare a frequency distribution table using one class interval as 30-35 in which 30 is included and 35 excluded. using the above data, draw a histogram.
View SolutionShoes of the following brands are sold in Nov. 2007 at a shoe store. Construct a pie chart for the data.
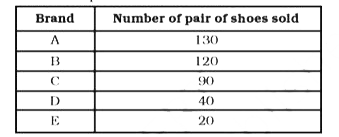
View SolutionThe following pie chart depicts the expenditure of a state government under different heads,
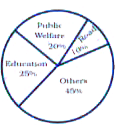
If the total spending is 10 crores, how much 20% do money was spent on roads?
View SolutionThe following pie chart depicts the expenditure of a state government under different heads,(if the total spending is 10 crores)

How many times is the amount of money Others spent on education compared to the amount spent on roads?
View SolutionThe following pie chart depicts the expenditure of a state government under different heads,
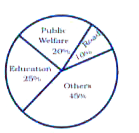
What fraction of the total expenditure is spent on both roads and public welfare together?
View SolutionThe following data represents the different number of animals in a zoo. Prepare a pie chart for the given data.
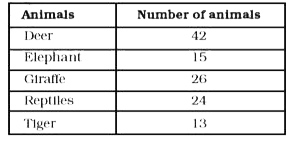
View SolutionPlaying cards
(a) From a pack of cards the following cards are kept face down:
 Suhail wins if he picks up a face card. Find the probability of Suhail winning?
View SolutionNow the following cards are added to the above cards:

What is the probability of Suhail winning now? Reshma wins if she picks up a 4. What is the probability of Reshma winning?
(Queen, King and Jack cards are called face cards.]
View SolutionConstruct a frequency table for the following weights (in gm) of 35 mangoes using the equal class intervals, one of them is 40-45 (45 not included): 30,40,45,32,43,50,55,62,70,70,61,62,53,52,50,42,35,37,53, 55,65,70,73,74,45,46,58,59,60,62,74,34,35,70,68 What is the class marks of the class interval 40-45? What is the range of the above weights? How many classes are there?
View SolutionConstruct a frequency table for the following weights (in gm) of 35 mangoes using the equal class intervals, one of them is 40-45 (45 not included): 30,40,45,32,43,50,55,62,70,70,61,62,53,52,50,42,35,37,53, 55,65,70,73,74,45,46,58,59,60,62,74,34,35,70,68 What is the class marks of the class interval 40-45? What is the range of the above weights? How many classes are there?
View SolutionComplete the following table:
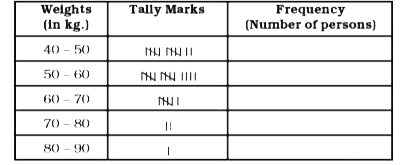
Find the total number of persons whose weights are given in the above table.
View SolutionDraw a histogram for the following data.

View SolutionIn a hypothetical sample of 20 people the amounts of money with them were found to be as follows: 114,108,100,98,101,109,117,119,126,131,136,143,156, 169,182,195,207,219,235,118. Draw the histogram of the frequency distribution (taking one of the class intervals as 50-100)
View SolutionThe histogram given below shows the number of literate females iin the age group of 10 to 40 years. Study the histogram carefully and answer the questions that follow.
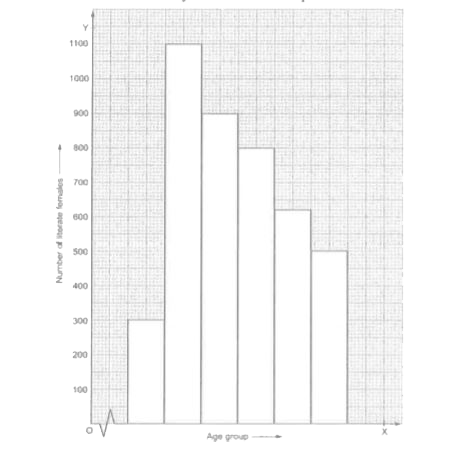
(i) Write the classes, assuming that all the classes are of equal width.
(ii) What is the class width?
(iii) In which age group are the literate females the least?
(iv) In which age group is the number of literate females the highest?
View SolutionThe below histogram shows the number of literate females in the age group of 10 to 40 years in a town.
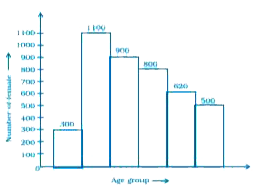
What is the classes width?
View SolutionThe below histogram shows the number of literate females in the age group of 10 to 40 years in a town.
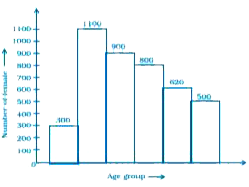
In which age group are literate females the least?
View SolutionThe below histogram shows the number of literate females in the age group of 10 to 40 years in a town.
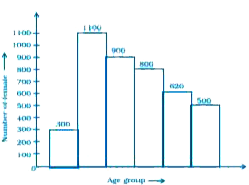
In which age group is the number of literate females the highest?
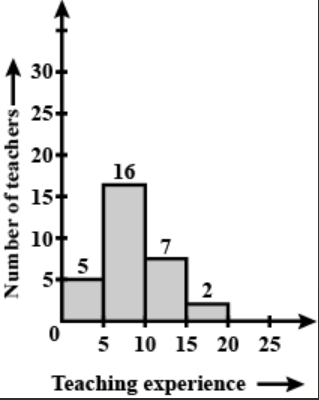
View SolutionThe following histogram shows the frequency distribution of teaching experiences of 30 teachers in various schools:
What is the class width?
View SolutionThe following histogram shows the frequency distribution of teaching experiences of 30 teachers in various schools:
How many teachers are having the maximum teaching experience and how many have the least teaching experience?

View SolutionThe following histogram shows the frequency distribution of teaching experiences of 30 teachers in various schools:
How many teachers have teaching experience of 10 to 20 years?

View SolutionIn a district, the number of branches of different banks is given below:

Draw a pie chart for this data.
View SolutionFor the development of basic infrastructure in a district, a project of Rs 108 crore approved by Development Bank is as follows:

Draw a pie chart for this data.
View SolutionIn the time table of a school, periods allotted per week to different teaching subjects are given below:

Draw a pie chart for this data.
View SolutionA survey was carried out to find the favourite beverage preferred by a certain group of young people. The following pie chart shows the findings of this survey. From this pie chart answer the following:
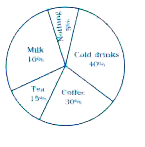
Which type of beverage is liked by the maximum number of people.
View SolutionA survey was carried out to find the favorite beverage preferred by a certain group of young people. The following pie chart shows the findings of this survey. From this pie chart answer the following:
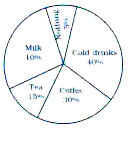
If 45 people like tea, how many people were surveyed?
View SolutionThe following data represents the approximate percentage of water in various oceans. Prepare a pie chart for the given data.
`{:("Pacific",40%),("Atlantic",30%),("Indian",20%),("Others",10%):}`
View SolutionAt a Birthday Party, the children spin a wheel to get a gift. Find the probability of
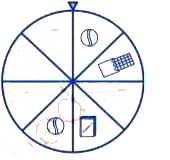
getting a ball
View SolutionAt a Birthday Party, the children spin a wheel to get a gift. Find the probability of

getting a toy car
View SolutionAt a Birthday Party, the children spin a wheel to get a gift. Find the probability of

any toy except a chocolate
View SolutionSonia picks up a card from the given cards.
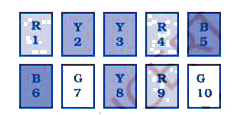
Calculate the probability of getting
an odd number
View SolutionSonia picks up a card from the given cards.
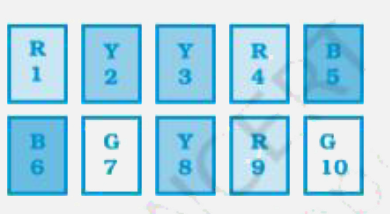
Calculate the probability of getting
a Y card
View SolutionSonia picks up a card from the given cards.
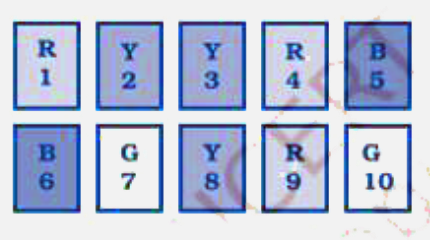
Calculate the probability of getting
(a) G card
View SolutionSonia picks up a card from the given cards.
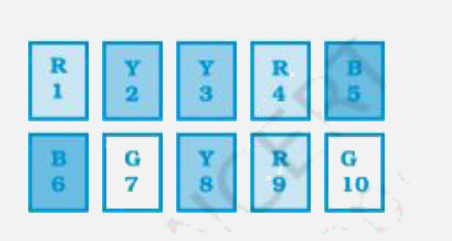
Calculate the probability of getting
B card bearing number `gt 7 `
View SolutionIdentify which symbol should appear in each sector in 113, 114.
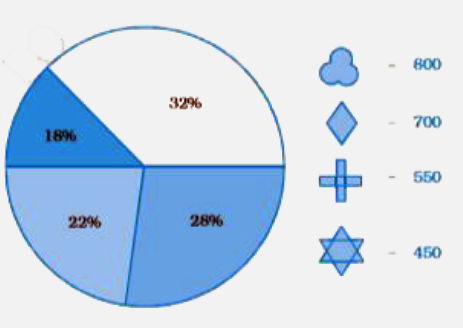
View Solution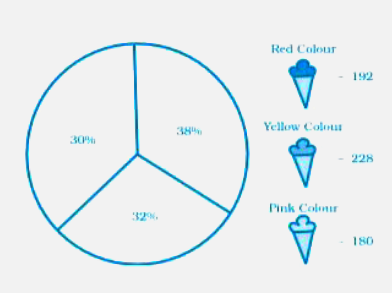
View SolutionA financial counselor gave a client this pie chart describing how to budget his income. If the client brings home Rs. 50,000 each month, how much should he spend in each category?
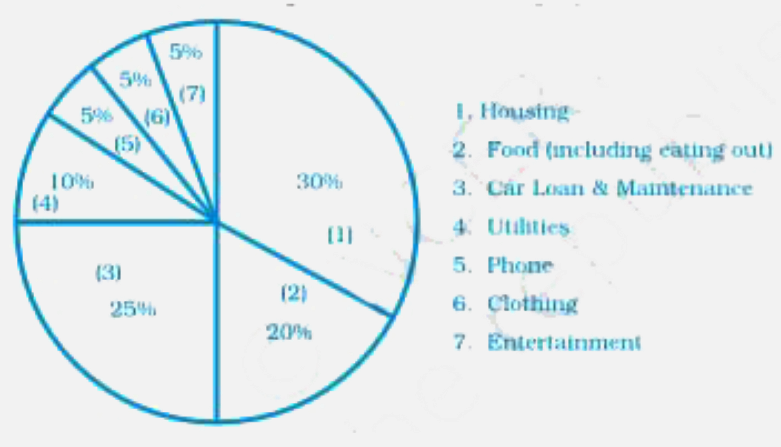
View SolutionFollowing is a pie chart showing the amount spent in rupees (in thousands) by a company on various modes of advertising for a product.
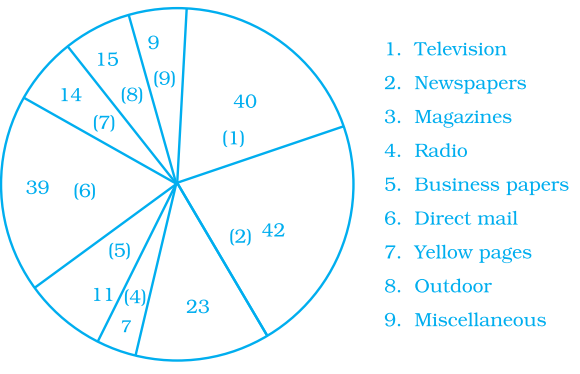
Which type of media advertising is the greatest amount of the total?
View SolutionFollowing is a pie chart showing the amount spent in rupees (in thousands) by a company on various modes of advertising for a product.
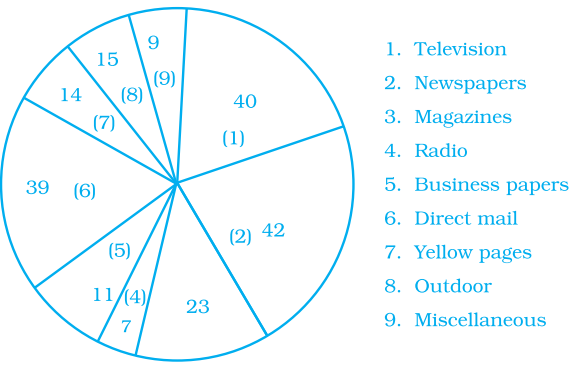
Which type of media advertising is the least amount of the total?
View SolutionFollowing is a pie chart showing the amount spent in rupees (in thousands) by a company on various modes of advertising for a product.
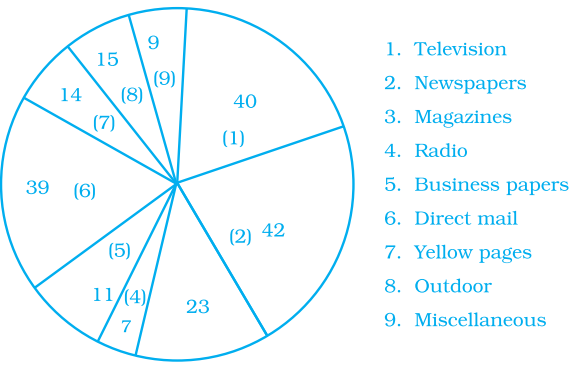
What per cent of the total advertising amount is spent on direct mail campaigns?
View SolutionFollowing is a pie chart showing the amount spent in rupees (in thousands) by a company on various modes of advertising for a product.
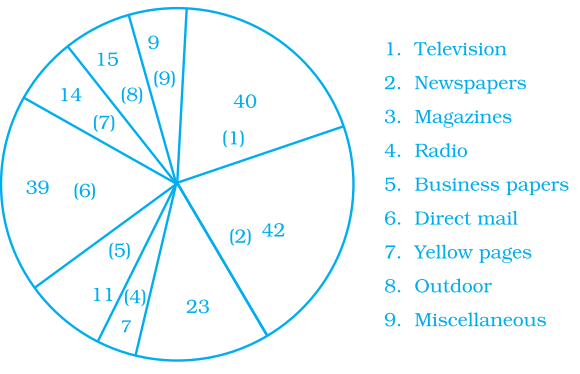
What per cent of the advertising amount is spent on newspaper and magazine advertisements?
View SolutionFollowing is a pie chart showing the amount spent in rupees (in thousands) by a company on various modes of advertising for a product.
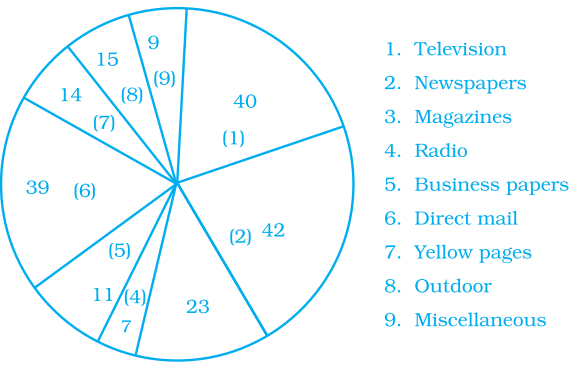
What media types do you think are included in miscellaneous? Why aren't those media types given their own category?
View Solution
EXERCISE questions and complete solutions for chapter DATA HANDLING of NCERT EXEMPLAR of Class 8