Complete Solutions to TEST YOUR CONCEPTS ( SHORT ANSWER TYPES QUESTIONS) of chapter STATISTICS of Class 8 book with complete answers and questions
| Class 8 | MATHS |
| Chapter | STATISTICS |
| PEARSON IIT JEE FOUNDATION | TEST YOUR CONCEPTS ( SHORT ANSWER TYPES QUESTIONS) |
| Number Of Questions | 13 |
| Academic Year | 2023-24 |
Find the mean of the following data.

View SolutionPercentage of marks of 35 students is given in the following grouped frequency distribution table.

How many students scored 70% and more than 70% of marks?
View SolutionPercentage of marks of 35 students is given in the following grouped frequency distribution table.

How many students scored less than 90% of marks?
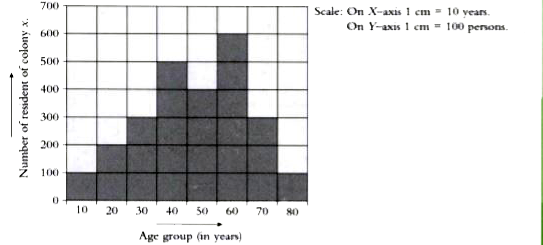
View SolutionRead the adjacent histogram and answer the following questions.

Find the group in which number of persons is more.
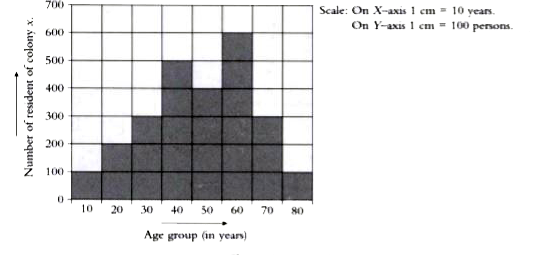
View SolutionRead the adjacent histogram and answer the following questions.

How many persons are there below 40 years?
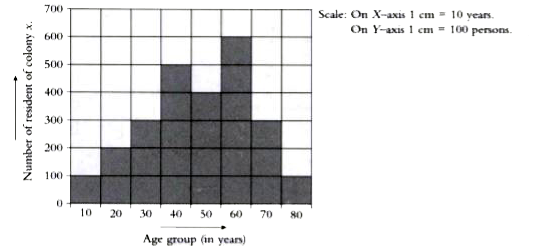
View SolutionRead the adjacent histogram and answer the following questions.

Number of persons in two groups are same. What are they?
View SolutionFind the mean, median, and mode for the follow ing data.

View SolutionFind the median for the following data.

View SolutionFind the mode for the following data.

View SolutionThe mode of the observations 11, 12, 13, 12, and 12 is
View SolutionIf median - mean = mode - mean, then relation between median and mode is _________
View SolutionThe mean of the following data is 2.

Find the value of k.
View SolutionIf a bar graph is drawn to the scale 1 cm = 100 units, then a bar of length `(P)/(10)` cm represents___________
View Solution
TEST YOUR CONCEPTS ( SHORT ANSWER TYPES QUESTIONS) questions and complete solutions for chapter STATISTICS of PEARSON IIT JEE FOUNDATION of Class 8