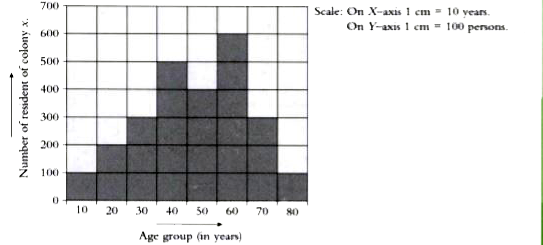
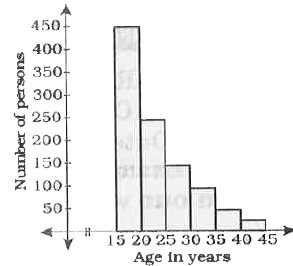
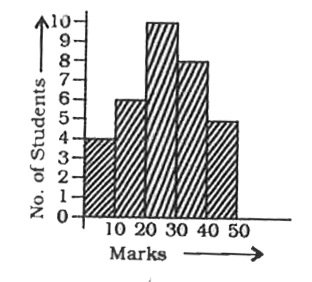
Read the adjacent histogram and answer the following questions.
Number of persons in two groups are same. What are they?
Step by step video & image solution for Read the adjacent histogram and answer the following questions. Number of persons in two groups are same. What are they? by Maths experts to help you in doubts & scoring excellent marks in Class 8 exams.
Updated on:21/07/2023Topper's Solved these Questions
- STATISTICS BOOK - PEARSON IIT JEE FOUNDATIONCHAPTER - STATISTICS EXERCISE - TEST YOUR CONCEPTS ( ESSAY TYPES QUESTIONS)
5 Videos
- STATISTICS BOOK - PEARSON IIT JEE FOUNDATIONCHAPTER - STATISTICS EXERCISE - CONCEPT APPLICATION (LEVEL 1)
31 Videos
- STATISTICS BOOK - PEARSON IIT JEE FOUNDATIONCHAPTER - STATISTICS EXERCISE - TEST YOUR CONCEPTS (VERY SHORT ANSWER TYPES QUESTIONS)
30 Videos
- SQUARES AND SQUARE ROOTS AND CUBES AND CUBE ROOTS BOOK - PEARSON IIT JEE FOUNDATIONCHAPTER - SQUARES AND SQUARE ROOTS AND CUBES AND CUBE ROOTS EXERCISE - Level 3
7 Videos
- TIME AND DISTANCE BOOK - PEARSON IIT JEE FOUNDATIONCHAPTER - TIME AND DISTANCE EXERCISE - Concept Application (Level 2 )
3 Videos
Similar Questions
Knowledge Check
Study the following histogram and answer the questions.
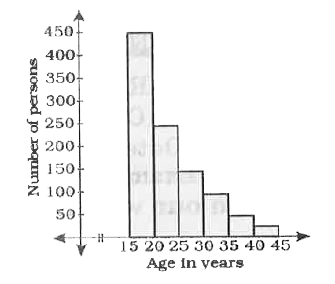
The number of persons in the age group 20 - 30 years is :A475B400C300D700Study the following histogram and answer the questions.
The total number of persons in the age group of 15 years to 45 years is :A450B800C1000D500Study the following Histogram and answer the following questions.
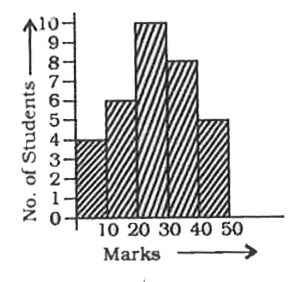
The total number of students involved in the data isA33B32C43D42
Read the passage and answer the following questions.

Identify the animal.
View SolutionRead the passage and answer the following questions.

Write any two uses of this animal.
View SolutionDirection :- Study the histogram and answer the following questions
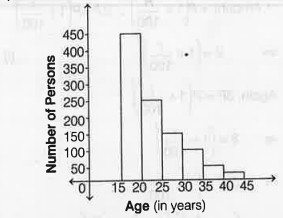 .
.
The ratio of the number of persons between the age group of 20-25 and 30-35 is
(A) 1:3
(B) 2:1
(C ) 10:3
(D) 6:1
View SolutionStudy the following Histogram and answer the following questions.
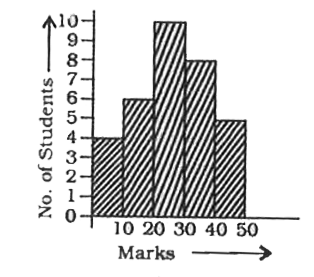
The least number of students got the marks in the interval
View SolutionStudy the following Histogram and answer the following questions.
The maximum number of students got the marks in the Interval of
View Solution

