Complete Solutions to EXERCISE of chapter STATISTICS of Class 9 book with complete answers and questions
| Class 9 | MATHS |
| Chapter | STATISTICS |
| MBD | EXERCISE |
| Number Of Questions | 41 |
| Academic Year | 2023-24 |
The weights (in kg) of 30 students of a class are 49, 48, 46, 48, 48, 50, 52, 53, 54, 43, 43, 41, 43, 55, 56, 48, 47, 41, 40, 49, 51, 51, 56, 46, 45, 44, 49, 53, 42 and 47. Prepare a frequency table for the above data and answer the following questions : What is the least weight ?
View SolutionThe weights (in kg) of 30 students of a class are 49, 48, 46, 48, 48, 50, 52, 53, 54, 43, 43, 41, 43, 55, 56, 48, 47, 41, 40, 49, 51, 51, 56, 46, 45, 44, 49, 53, 42 and 47. Prepare a frequency table for the above data and answer the following questions : Find the number of students having the least weight in the above data.
View SolutionThe weights (in kg) of 30 students of a class are 49, 48, 46, 48, 48, 50, 52, 53, 54, 43, 43, 41, 43, 55, 56, 48, 47, 41, 40, 49, 51, 51, 56, 46, 45, 44, 49, 53, 42 and 47. Prepare a frequency table for the above data and answer the following questions : Find the number of students having the maximum weight in the above data.
View SolutionThe weights (in kg) of 30 students of a class are 49, 48, 46, 48, 48, 50, 52, 53, 54, 43, 43, 41, 43, 55, 56, 48, 47, 41, 40, 49, 51, 51, 56, 46, 45, 44, 49, 53, 42 and 47. Prepare a frequency table for the above data and answer the following questions : Which weight is possessed by the maximum number of students ?
View SolutionConstruct a grouped frequency table with class intervals 0-5, 5 -10 and so on for the following marks obtained in Biology (out of 50) by a group of 35 students in an examination : 0, 5, 6, 7, 10, 12, 14, 15, 20, 22, 25, 26, 27, 8, 11, 17, 3, 6, 9, 17, 19, 21, 22, 29, 31, 35,37, 40, 42, 45, 49, 4, 50, 16 and 20.: What is the range of the data ?
View SolutionConstruct a grouped frequency table with class intervals 0-5, 5 -10 and so on for the following marks obtained in Biology (out of 50) by a group of 35 students in an examination : 0, 5, 6, 7, 10, 12, 14, 15, 20, 22, 25, 26, 27, 8, 11, 17, 3, 6, 9, 17, 19, 21, 22, 29, 31, 35,37, 40, 42, 45, 49, 4, 50, 16 and 20.: Which group contains the maximum number of students ?
View SolutionPulse rate (per miute) of 30 persons were recorded as
61,76,72,73,71,66,78,73,68,81,78,63,72,75,80,68,75,62,71,81,73,60,79,72,73,74,71,64,76 and71.
Construct a frequency table using class-invervals of equal width,one class interval being (60-65).
View SolutionPulse rate (per miute) of 30 persons were recorded as
61,76,72,73,71,66,78,73,68,81,78,63,72,75,80,68,75,62,71,81,73,60,79,72,73,74,71,64,76 and71.
Construct a frequency table using class-invervals of equal width,one class interval being (60-65).
View SolutionPulse rate (per miute) of 30 persons were recorded as
61,76,72,73,71,66,78,73,68,81,78,63,72,75,80,68,75,62,71,81,73,60,79,72,73,74,71,64,76 and71.
Construct a frequency table using class-invervals of equal width,one class interval being (60-65).
View SolutionPulse rate (per miute) of 30 persons were recorded as
61,76,72,73,71,66,78,73,68,81,78,63,72,75,80,68,75,62,71,81,73,60,79,72,73,74,71,64,76 and71.
Construct a frequency table using class-invervals of equal width,one class interval being (60-65).
View SolutionA family with monthly income of Rs. 20,000 had planned the following expenditures under various heads :
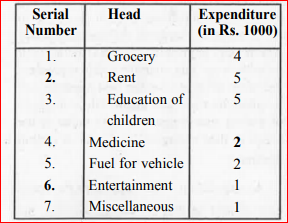 Draw a bar graph for the above data.
View SolutionConsider the following frequency distribution table representing the weights of 40 students of a class .
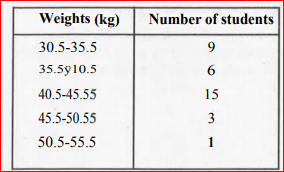
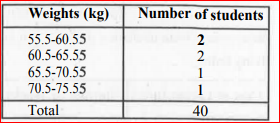 Draw a histogram to represent the above data.
View SolutionThe following distribution gives the time taken by 25 students to solve a problem.
 Draw a histogram to represent the above Data.
View SolutionThe following table presents the number of literate females in the age group (10-34) in town.
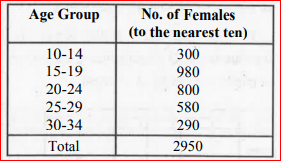 Draw a histogram to represent the above data
View SolutionFor the following data, draw a frequency polygon
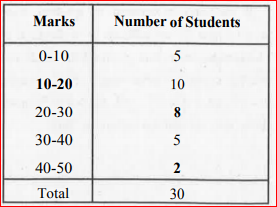 .
.
View SolutionIn a city, the following weekly observations were made in a study on cost of living index :
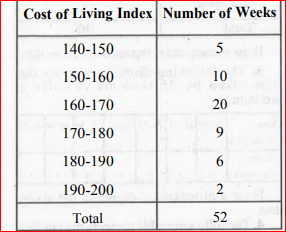 Draw a histogram and frequency polygon for the above data on the same graph.
View SolutionThe following table gives the distribution of IQ (intelligence Quotient) of 60 pupils of class IX in a school
 Draw a histrogram to represent the above data.
View SolutionA teacher wanted to analyse the performance of two sections of students in a Mathematics test. She grouped the students into the categories obtaining marks between 0 - 35, 35 - 50, 50 - 60, 60 - 75, 75 and above and formed the following table :
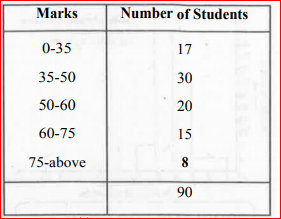 Prepare a histogram to respresent the above data.
View SolutionThe mean of 96, 98, x, 102, 104 is 100, find x.
View SolutionFind the mean of all possible factors of 20.
View SolutionFind the mean of 25, 27, 19, 29, 21, 23, 25, 30, 28, 20 and prove that the sum of the deviation taken from the mean is zero.
View SolutionLet m be the mid-point and l be the upper class limit of a class in a continuous frequency ditribution. The lower class limit of the class is :
View SolutionThe class marks of a frequency distribution are given as follows : 15, 20, 25, The class corresponding to the class mark 20 is :
View SolutionIn the class intervals 10-20, 20-30, the number 20 is included in.
View SolutionA grouped frequency table with class intervals of equal sizes using 250 -270 (270 not included in this interval) as one of the class interval is constructed observations for the following data : 268, 220, 368, 258, 242, 310, 272, 342, 310, 290, 300, 320, 319, 304, 402, 318, 406, 292, 354, 278, 210, 240, 330, 316, 406, 215, 258, 236. The frequency of the class 310 - 330 is :
View SolutionA grouped frequency distribution table with classes of equal sizes using 63 - 72 (72 included) as one of the class is constructed for the following data : 30, 32, 45, 54, 74, 78, 108, 112, 66, 76, 88, 40, 14, 20, 15, 35, 44, 66, 75, 84, 95, 96, 102, 110, 88, 74, 112, 14, 34, 44. The number of classes in the distribution will be :
View SolutionTo draw a histogram to represent the following frequency ditribution :
 the adjusted frequency for the class 25 - 45 is :
View SolutionThe mean of five numbers is 30. If one number is excluded, their mean becomes 28. The excluded number is :
View SolutionIf the mean of the observations : x, x + 3, x + 5, x + 7, x + 10 is 9, the mean of the last three observations is
View SolutionIf `barx` represents the mean of n observations `x_1, x_2,…….,x_n` , then value of `sum_(i=1)^n (x_1-barx)` is :
View SolutionIf each observation of the data is increased by 5, then their mean
View SolutionLet `barx` be the mean of `x_1,x_2,……,x_n` and `bary` the mean of `y_1,y_2……,y_n` `barz` is the mean of `x_1,x_2,…. ,x_n, y_1, y_2` is equal to :
View SolutionIf `barx` is the mean of x1,x2,x3, ………..xn , then for a`ne`0, the mean of `ax_1,ax_2,…..,ax_n,(x_2)/a, (x_2)/a ,……., (x_n)/a` is :
View SolutionIf `barx_1,barx_2,barx_3,….., barx_n` are the means of n groups with `n_1,n_2,…..n_i` numbers of observation respectively , then the mean `barx` of all the group taken together is given by
View SolutionThe mean of 100 observations is 50. If one of the observations which was 50 is replaced by 150, the resulting mean will be :
View SolutionThere are 50 numbers. Each number is subtracted from 53 and the mean of the numbers so obtained is found to be -3.5. The mean of the given number is:
View SolutionThe mean of 25 observations is 36. Out of these observationsif the mean of first 13 observations is 32 and that of the last 13 observations is 40, the 13th observation is :
View SolutionThe median of the data 78, 56, 22, 34, 45, 54, 39, 68, 54, 84 is
View SolutionFor drawing a frequency polygon of a continuous frequency distribution, we plot the points whose ordinates are the frequency of the respective classes and abcissae are respectively :
View SolutionMedian of the following numbers : 4, 4, 5, 7, 6, 7, 7, 12, 3 is
View SolutionMode of the data 15, 14, 19, 20, 14, 15, 1 6, 14, 15, 18, 14, 19, 15, 17, 15 is
View Solution
EXERCISE questions and complete solutions for chapter STATISTICS of MBD of Class 9