Complete Solutions to SOLVED EXAMPLES of chapter STATISTICS of Class 9 book with complete answers and questions
| Class 9 | MATHS |
| Chapter | STATISTICS |
| MTG IIT JEE FOUNDATION | SOLVED EXAMPLES |
| Number Of Questions | 28 |
| Academic Year | 2023-24 |
The water tax bills (in rupees) of 30 houses in a locality are given below. Construct a grouped frequency distribution with class size of 10. 30,32,45,54,74,78,108,112,66,76,88,40,14,20,15,35,44,66, 75,84,95,96,102,110,88,74,112,14,34,44
View SolutionForm a grouped frequency distribution from the following data by inclusive method taking 4 as the class size of class intervals.
31, 23, 19, 29, 22, 20, 16, 10, 13, 34, 38, 33, 28, 21, 15, 18, 36, 24, 18, 15, 12, 30, 27, 23, 20, 17, 14, 32, 26, 25, 18, 29, 24, 19, 16, 11, 22, 15, 17,10
View SolutionRead the bar graph shown in figure and answer the following questions.
What is the information given by the bar graph?
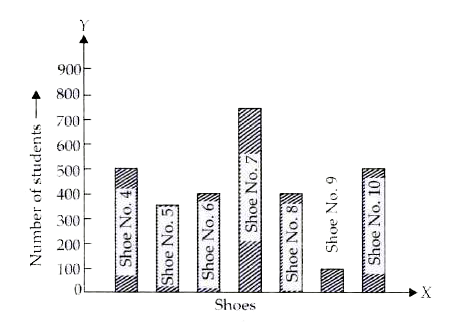
View SolutionRead the bar graph shown in figure and answer the following questions.
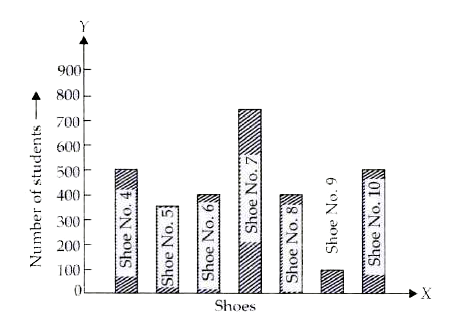
What are the different numbers of the shoesworn by the students?
View SolutionRead the bar graph shown in figure and answer the following questions.
Which shoe number is worn by the maximum number of students? Also give its number
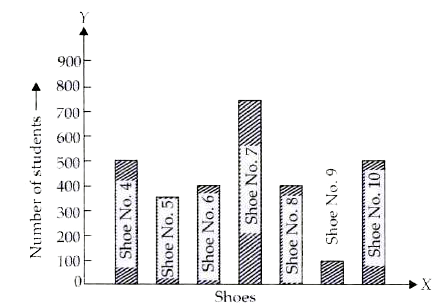
View SolutionRead the bar graph shown in figure and answer the following questions.
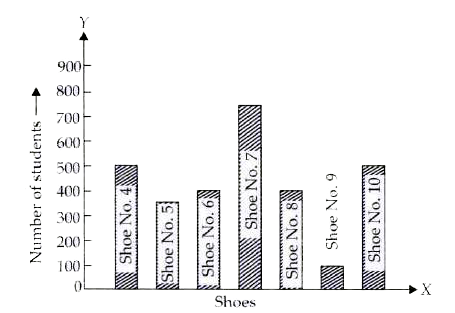
Which shoe number is worn by the minimum number of students? Also give its frequency.
View SolutionRead the bar graph shown in figure and answer the following questions.
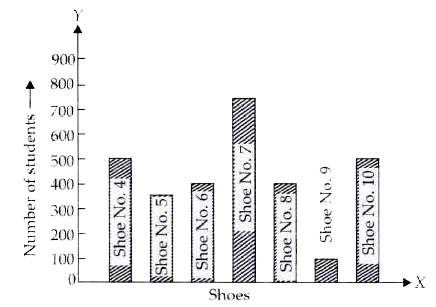
The number of students wearing shoe No. 10 is less than three times the number of students wearing shoe No. 9. Is it true ?
View SolutionRead the following bar graph given in figure and answer the following questions.
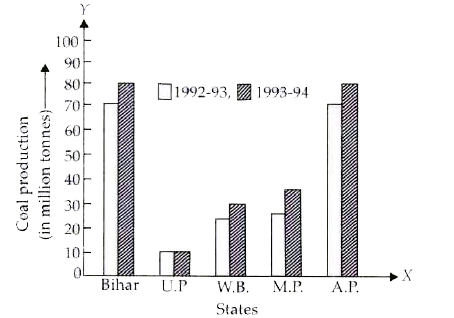
(i) What information is given by this bar graph?
View SolutionRead the following bar graph given in figure and answer the following questions.
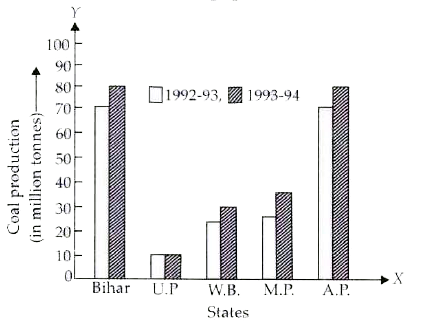
Which two states have same production in 1993-94?
View SolutionRead the following bar graph given in figure and answer the following questions.
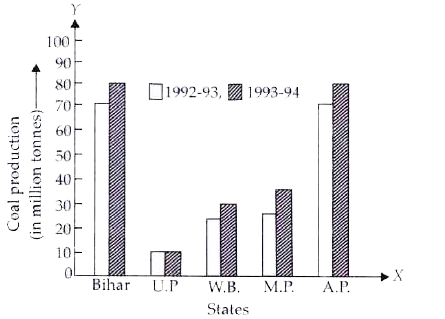
Name the state having same production in both the years?
View SolutionRead the following bar graph given in figure and answer the following questions.
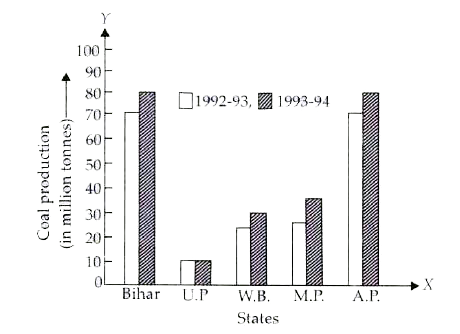
Which state has minimum production?
View SolutionThe following table gives the marks scored by 100 students in an entrance examination
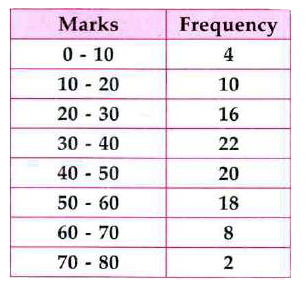
Represent this data in the form of a histogram.
View SolutionDraw a histogram for the marks of students given below :

View SolutionThe given table presents the number of illiterate males in the age group (10-34) in a town.

Draw a histogram to represent the above data.
View SolutionFor the following data, draw a histogram and a frequency polygon
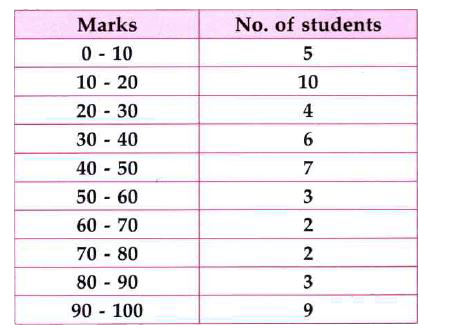
View SolutionConstruct a frequency polygon for the following data.
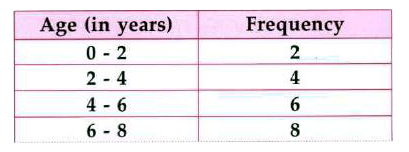
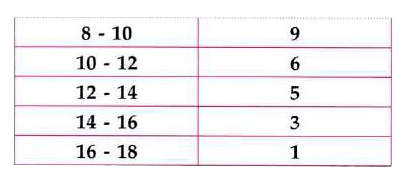
View SolutionThe mean of 100 items was found to be 30. If at the time of calculation two items were wrongly taken as 32 and 12 instead of 23 and 11, find the correct mean.
View SolutionThe mean of 10 number is 20. If 5 is subtracted from every number, what will be the new mean?
View SolutionThe mean of 16 numbers is 8. If 2 is added to every number, what will be the new mean?
View SolutionFind the mean of the following distribution.

View SolutionFind the mean of the following distribution

View SolutionFind the frequencies in the following frequency distribution if it is known that the mean of the distribution is 1.46.
View SolutionFind the median of the following data : 25, 34, 31, 23, 22, 26, 35, 29, 20, 32
View SolutionFind the median of the following data: 41, 43, 127, 99, 61, 92, 71, 58, 57. If 58 is replaced by 85, what will be the new median.
View SolutionThe weights (in kg) of 15 students are : 31, 35, 27, 29, 32, 43, 37, 41, 34, 28, 36, 44, 45, 42, 30. Find the median. If the weight 44 kg is replaced by 46 kg and 27 kg by 25 kg, find the new median.
View SolutionFind out the mode of the following marks obtained by 15 students in a class.
Marks : 4, 6, 5, 7, 9, 8, 10, 4, 7, 6, 5, 9, 8, 7, 7
View SolutionFind the mode from the following data: 125, 175, 225, 125, 225, 175, 325, 125, 375, 225, 125
View SolutionThe demand of different shirt sizes, as obtained by a survey, is given below :

Find the mean as observed from the survey .
View Solution
SOLVED EXAMPLES questions and complete solutions for chapter STATISTICS of MTG IIT JEE FOUNDATION of Class 9
All Exercises from MTG IIT JEE FOUNDATION Class 9 MATHS STATISTICS
- Exercise ( Integer/Numerical Value Type )
- Exercise ( Subjective Problems ) ( Long Answer Type )
- Exercise ( Subjective Problems ) ( Short Answer Type )
- Exercise ( Subjective Problems ) (Very Short Answer Type )
- Exercise (Assertion and Reason Type)
- Exercise (Comprehension Type)
- Exercise (Match the following)
- Exercise (Multiple Choice Question)
- ILLUSTRATIONS
- NCERT SECTION (Exercise 14.1)
- NCERT SECTION (Exercise 14.2)
- NCERT SECTION (Exercise 14.3)
- NCERT SECTION (Exercise 14.4)
- Olympiad/HOTS Corner
- SOLVED EXAMPLES