Complete Solutions to LONG ANSWER TYPE QUESTIONS of chapter STATISTICS AND PROBABILITY of Class 9 book with complete answers and questions
| Class 9 | MATHS |
| Chapter | STATISTICS AND PROBABILITY |
| NCERT EXEMPLAR | LONG ANSWER TYPE QUESTIONS |
| Number Of Questions | 5 |
| Academic Year | 2023-24 |
The following are the marks (out of 100) of 60 students in Mathematics.
16,13,5,80,7,51,48,24,56,70,19,17,16,36,34, 42,34,42,34,34,35,72,55,75,31,52,28,97,74,45,62,68,86, 35,85,36,81,75,55,26,95,31,7,78,92,62,52,56,15,63,25,36,54,44,47,27,72,17,4,30`.
Construct a grouped frequency table with width 10 of each class starting from 0-9.
View SolutionConstruct a grouped frequency distribution table with width 10 of each class, in such a way that one of the class is 10-20 (20 not included).
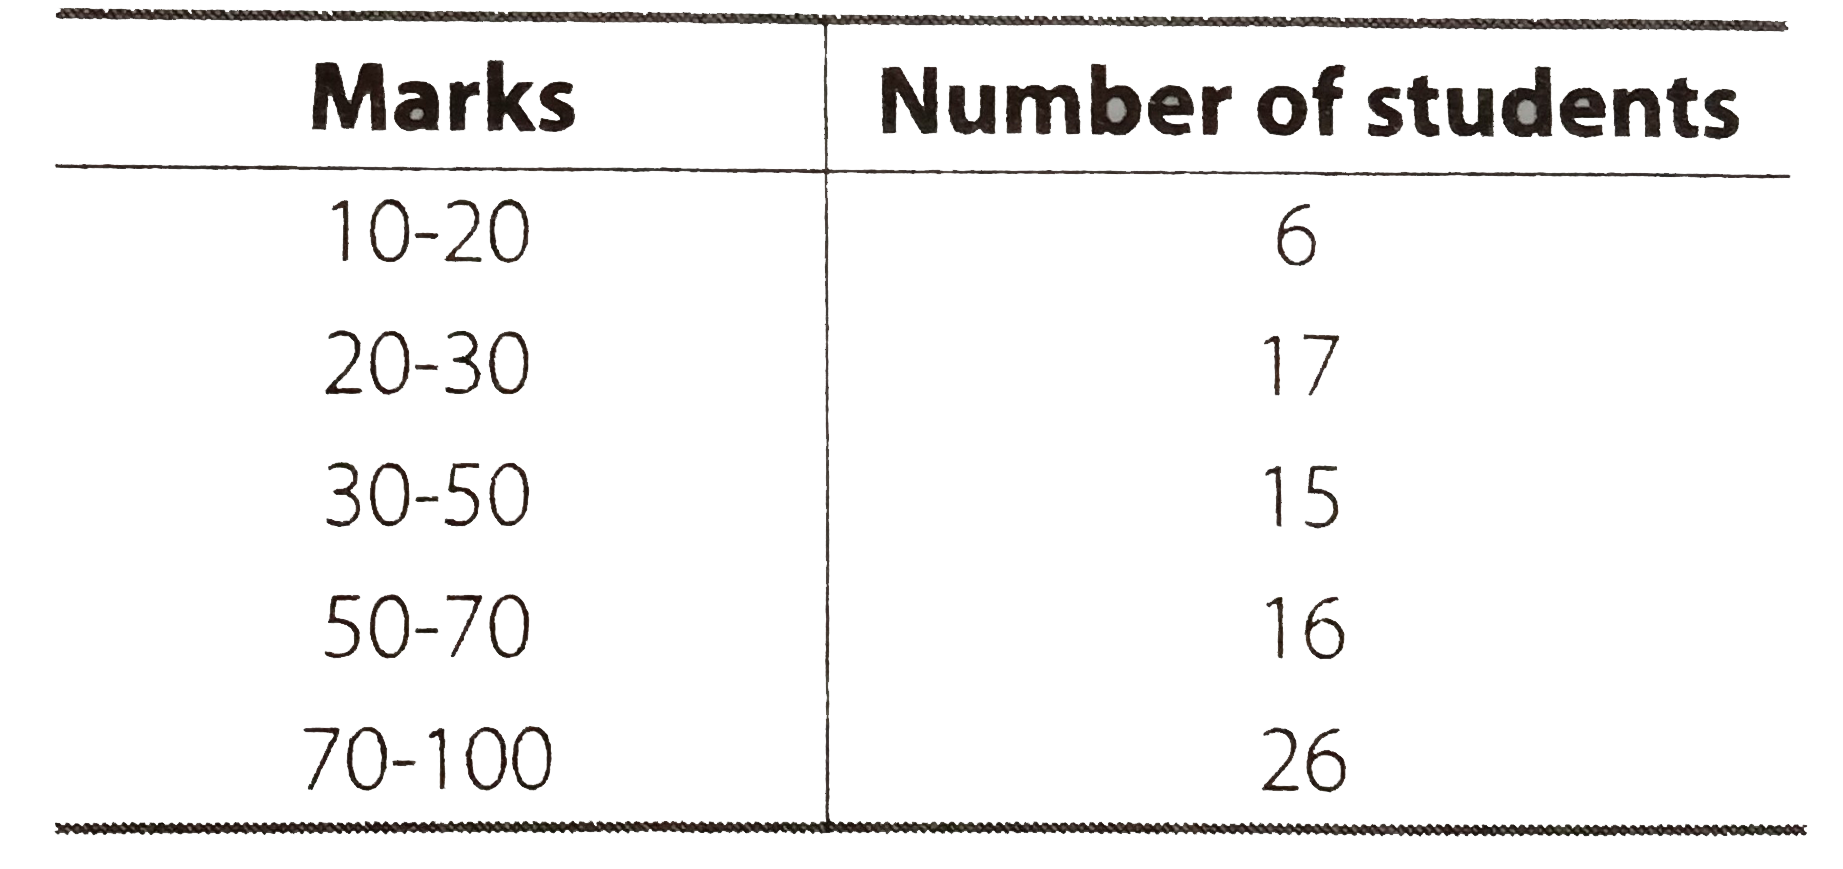
View SolutionThe marks obtained (out of 100) by a class of 80 students are given below

View SolutionFollowing table shows a frequency distribution for the speed of cars passing through at a particular spot on a high way.

Draw a histogram and frequency polygon representing the data above.
View SolutionRefer to Q. 7. Draw the frequency polygon representing the above data without drawing the histogram.
View Solution
LONG ANSWER TYPE QUESTIONS questions and complete solutions for chapter STATISTICS AND PROBABILITY of NCERT MATHS (HINGLISH) of Class 9