Complete Solutions to Solved Examples of chapter STATISTICS of Class 9 book with complete answers and questions
| Class 9 | MATHS |
| Chapter | STATISTICS |
| Mathematics | Solved Examples |
| Number Of Questions | 14 |
| Academic Year | 2023-24 |
A family with a monthly income of Rs 20,000 had planned the following expenditures per month under various heads
View SolutionThe points scored by a Kabaddi team in a series of matches are as follows: 17, 2, 7, 27, 15, 5, 14, 8, 10, 24, 48, 10, 8, 7, 18, 28 Find the median of the points scored by the team.
View SolutionFind the mean of the marks obtained by 30 students of Class IX of a school, 10 20 36 92 95 40 50 56 60 70 92 88 80 70 72 70 36 40 36 40 92 40 50 50 56 60 70 60 60 88
View Solution5 people were asked about the time in a week they spend in doing social work in their community. They said 10, 7, 13, 20 and 15 hours, respectively. Find the mean (or average) time in a week devoted by them for social work.
View SolutionConsider a small unit of a factory where there are `5` employees : a supervisor and four labourers. The labourers draw a salary of `Rs 5,000` per month each while the supervisor gets `Rs 15,000` per month. Calculate the mean, median and mode of the salaries of this unit of the factory.
View SolutionFind the mode of the following marks (out of 10) obtained by 20 students:4, 6, 5, 9, 3, 2, 7, 7, 6, 5, 4, 9, 10, 10, 3, 4, 7, 6, 9, 9
View SolutionConsider the marks obtained by 10 students in a mathematics test as given below: 55 36 95 73 60 42 25 78 75 62 The data in this form is called raw data. By looking at it in this form, can you find the highest and the lowest marks?
View SolutionConsider the marks obtained (out of 100 marks) by 30 students of Class IX of a school: 10 20 36 92 95 40 50 56 60 7092 88 80 70 72 70 36 40 36 4092 40 50 50 56 60 70 60 60 88 Recall that the number of students who have obtained a certain number of marks is called the frequency of those marks. For instance, 4 students got 70 marks. So the frequency of 70 marks is 4. To make the data more easily understandable, tabulate the data.
View Solution100 plants each were planted in 100 schools during Van Mahotsava. After one month, the number of plants that survived were recorded as:
95 67 28 32 65 65 69 33 98 9676 42 32 38 42 40 40 69 95 9275 83 76 83 85 62 37 65 63 4289 65 73 81 49 52 64 76 83 9293 68 52 79 81 83 59 82 75 8286 90 44 62 31 36 38 42 39 8387 56 58 23 35 76 83 85 30 6869 83 86 43 45 39 83 75 66 8392 75 89 66 91 27 88 89 93 4253 69 90 55 66 49 52 83 34 36
Tabulate the given data in suitable groups using tally marks.
View SolutionLet us now consider the following frequency distribution table which gives the weights of 38 students of a class:
View SolutionIn a particular section of Class `IX, 40` students were asked about the months of their birth and the following graph was prepared for the data so obtained:Observe the bar graph given above and answer the following questions:
(i) How many students were born in the month of November? (ii) In which month were the maximum number of students born?
View SolutionA teacher wanted to analysis the performance of two sections of students in a mathematics test of 100 marks. Looking performance, she found that a few students got under 20 marks and a few got 70 marks or above. So she decided to group them into intervals of varying sizes as follows :
0-20, 20-30, ....., 60-70, 70-100. Then she formed the following table :
`|{:("Marks"," Number of students"),(0-20," 7"),(20-30," 10"),(30-40," 10"),(40-50," 20"),(50-60," 20"),(60-70," 15"),(70-"above"," 8"),("Total"," 90"):}|`
(i) Find the probability that a student obtained less than `20%` in the mathematics test.
(ii) Find the probability that a student obtained marks 60 or above .
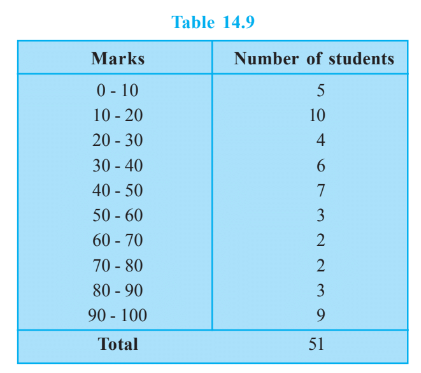
View SolutionConsider the marks, out of 100, obtained by 51 students of a class in a test, given in Table 14.9

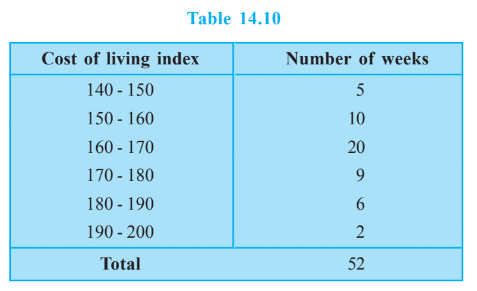
View SolutionIn a city of weekly observations made in a study on the cost of loving index are given in the following to draw a frequency polygon (without constructing histogram )

View Solution
Solved Examples questions and complete solutions for chapter STATISTICS of NCERT MATHEMATICS(HINGLISH) of Class 9