In a city of weekly observations made in a study on the cost of loving index are given in the following to draw a frequency polygon (without constructing histogram )
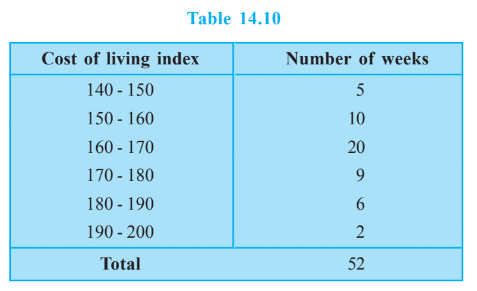
A frequency polygon is another type of frequency distribution graph. In a frequency polygon, the number of observations is marked with a single point at the midpoint of an interval. A straight line then connects each set of points.
Similar Questions
In a city of weekly observations made in a study on the cost of loving index are given in the following to draw a frequency polygon (without constructing histogram )
 View Solution
Construction of frequency polygon without using Histogram.
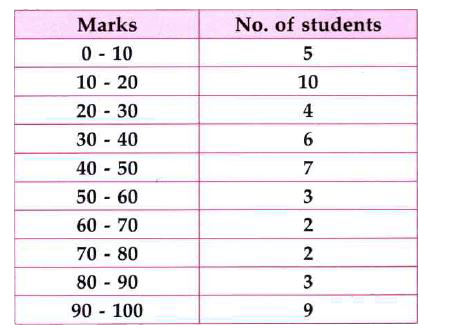
View SolutionFor the following data, draw a histogram and a frequency polygon
 View Solution
Construction of frequency polygon by using Histogram
View SolutionDraw a frequency polygon to represent the following data.
 View Solution
In a city, the weekly observations made on cost of living index are given below. One week is chosen at random.
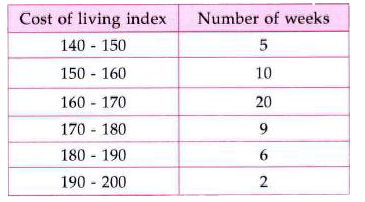
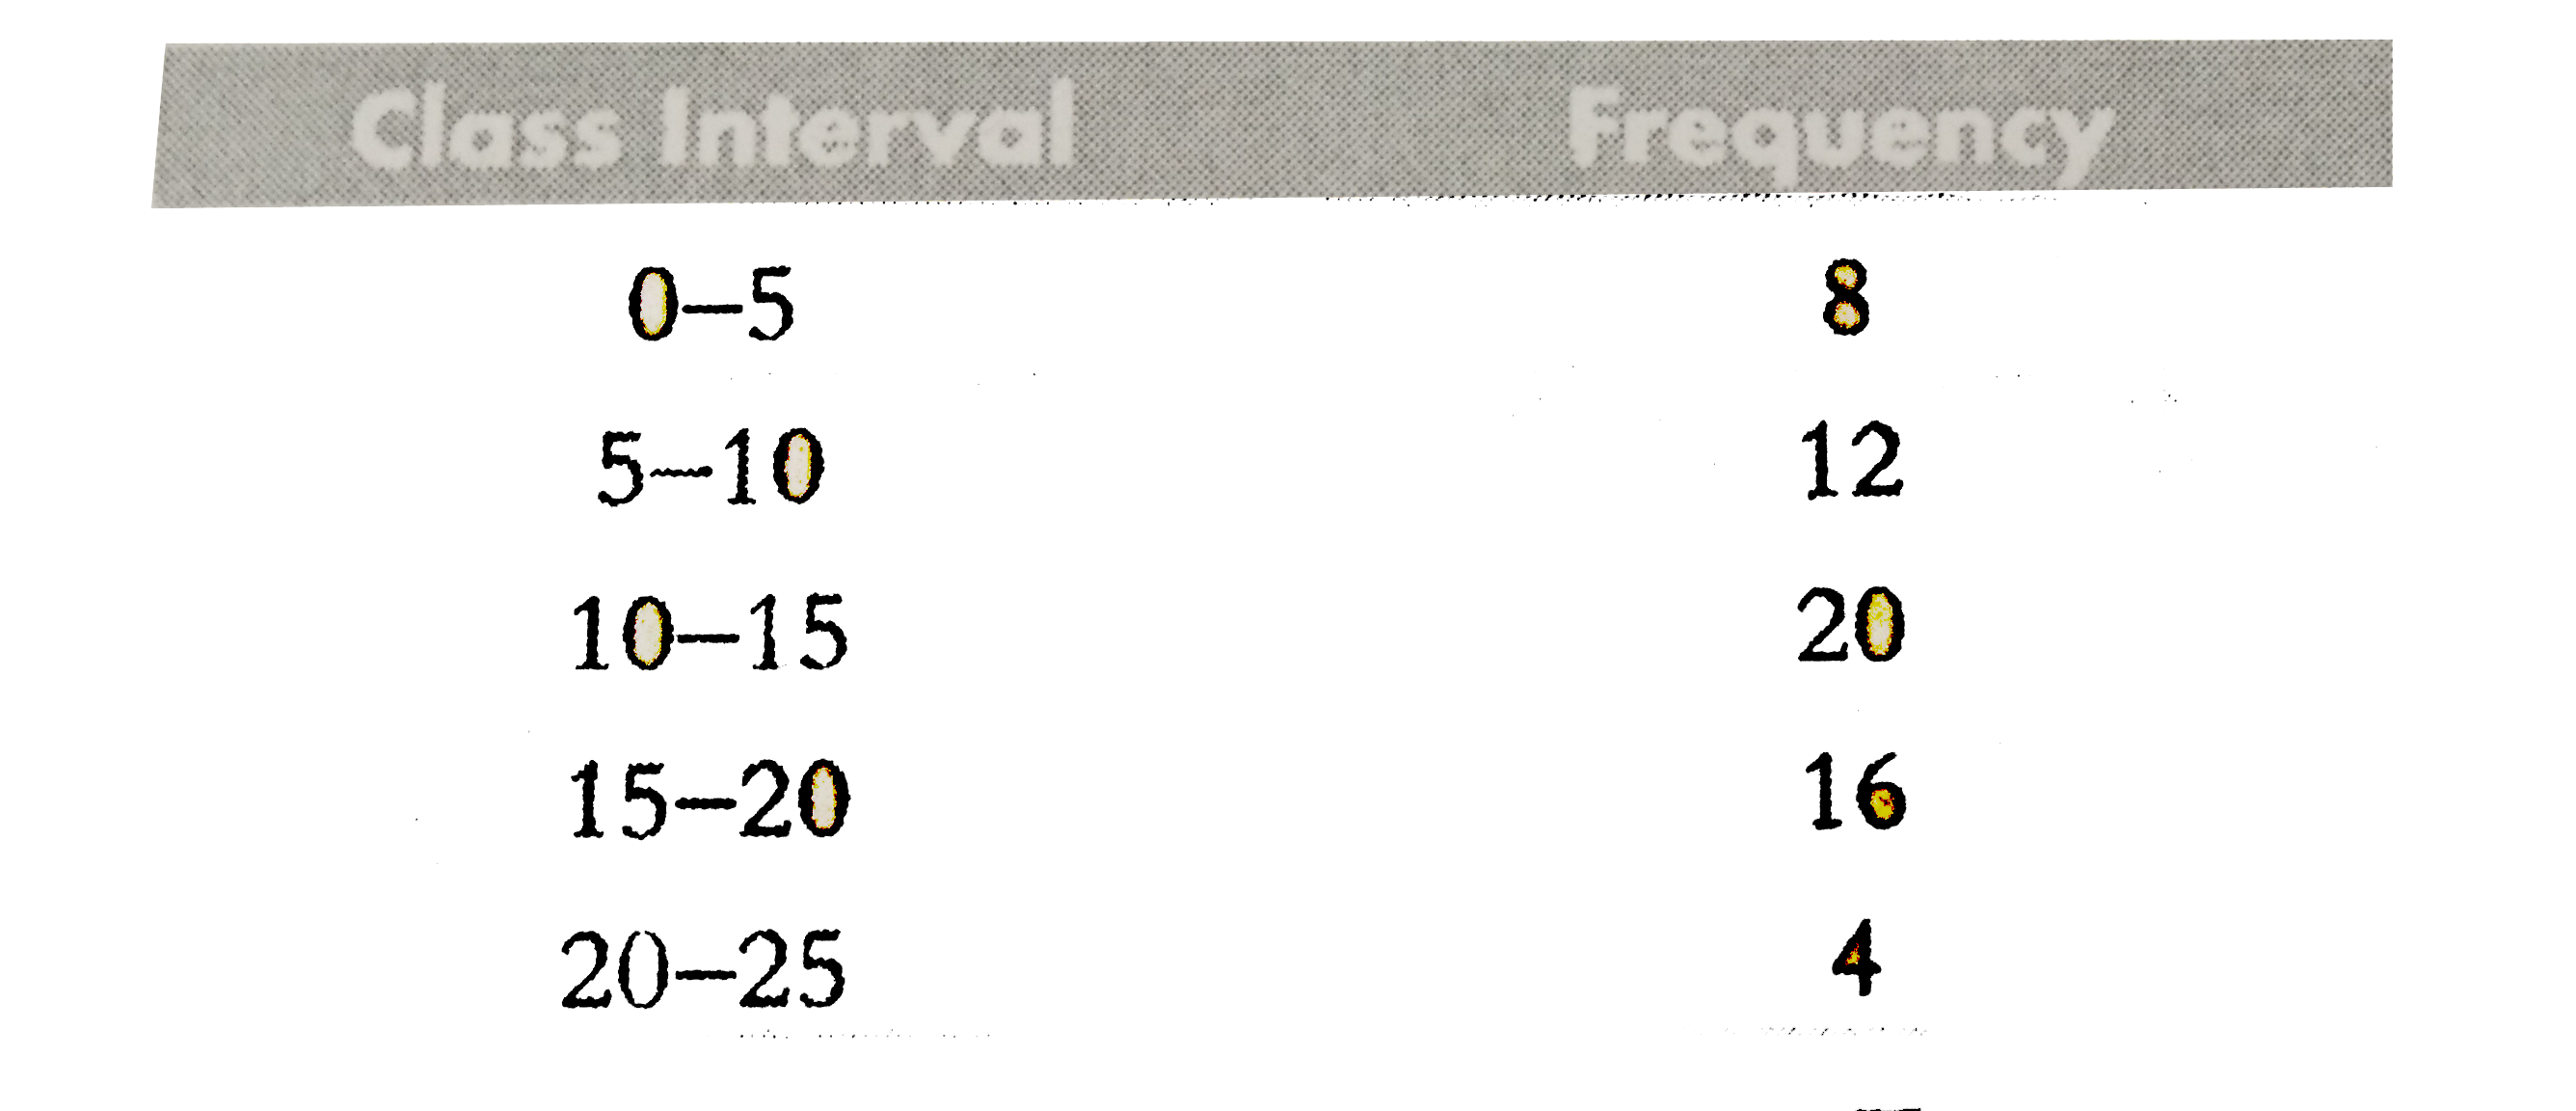
Find the probability that chosen week has cost of living greater than 150 but less than 170.View SolutionDraw the frequency polygon for the following distribution :
 View Solution
Construct a frequency polygon for the following data.
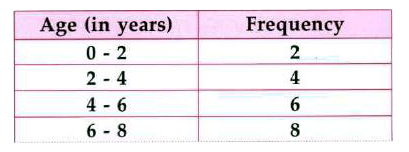
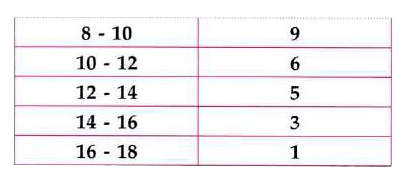 View Solution
Draw histogram and frequency polygon for the following distribution :
 View Solution
Make a frequency polygon and histogram using the given data :
 View Solution

