Multiple Choice Question from KAPLAN INC MATHS (ENGLISH) Chapter 051:SCATTERPLOTS for Class 10
| Class 10 | MATHS |
| Chapter | SCATTERPLOTS |
| KAPLAN INC MATHS (ENGLISH) | Multiple Choice Question |
| Medium | English |
| Academic Year | 2023-2024 |
Question 1
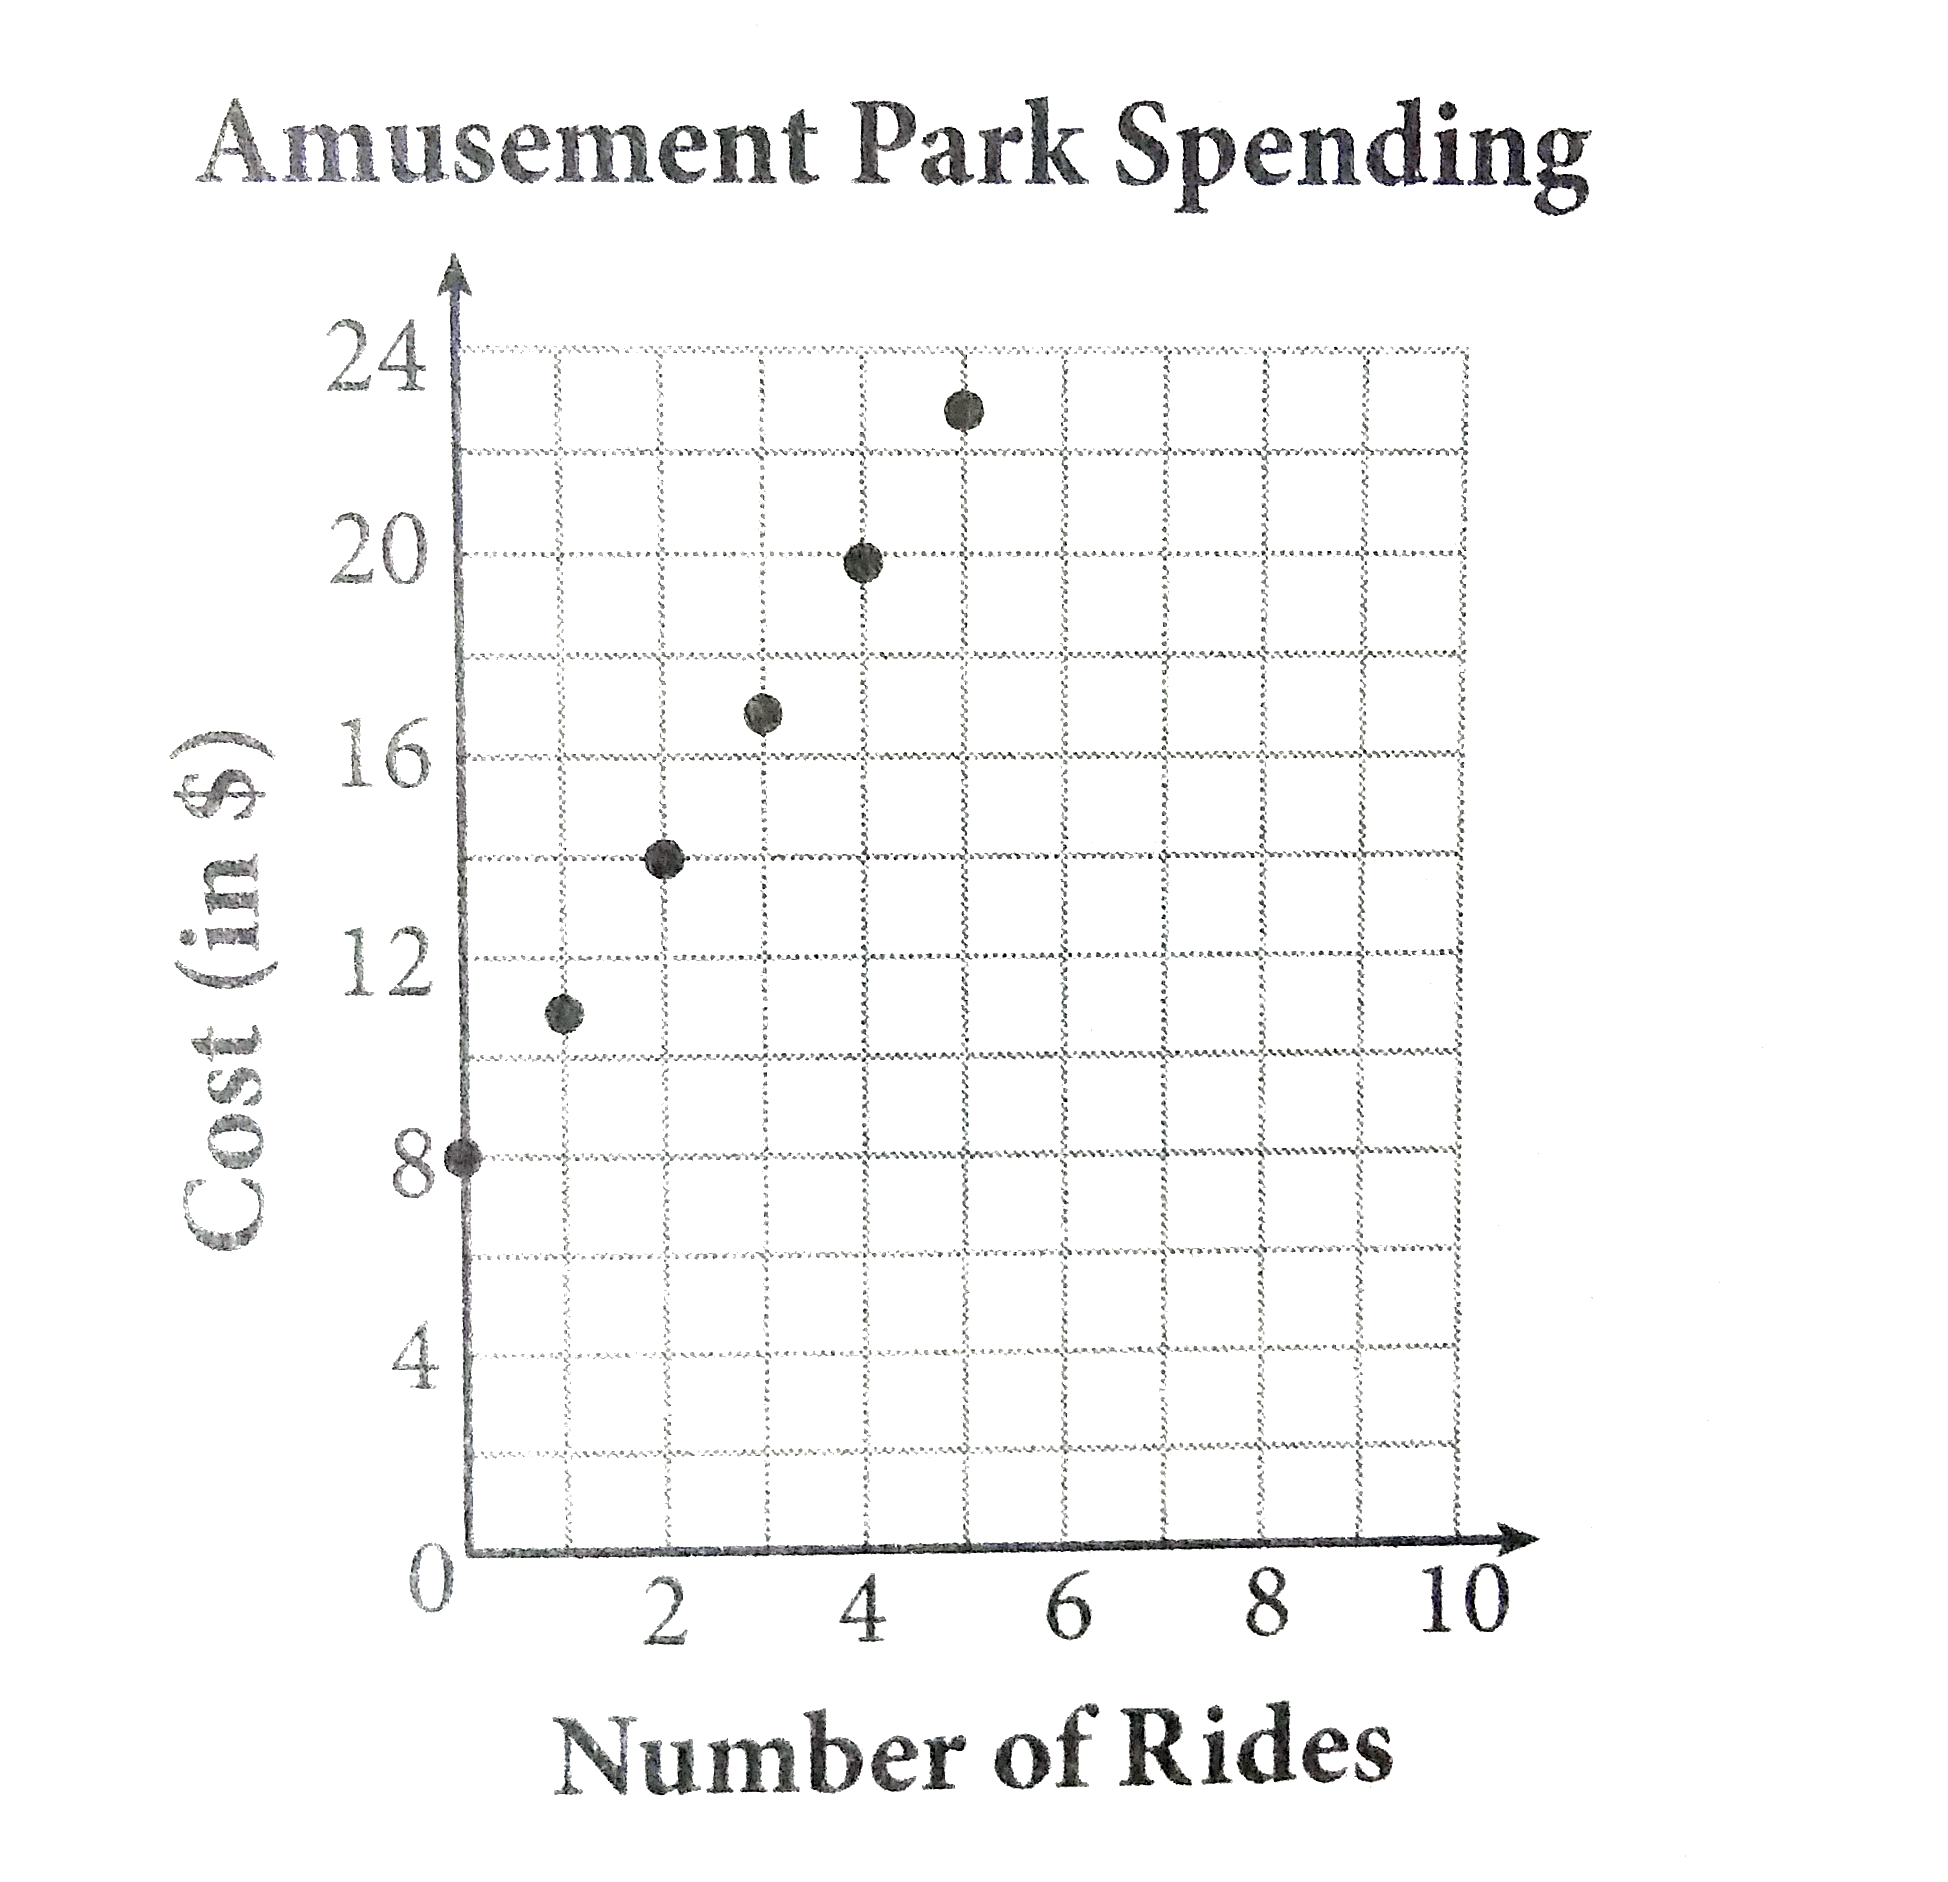
Wesley went to an amusement park with his family. He paid for his own admission ticket and all of the rides he rode. The scatterplot shows possible amounts that he could have paid. If a line of best fit (not shown) is used to model the data, the equation of the line would by y=3x+8. In this scenario, what does 3 represent? View SolutionQuestion 5
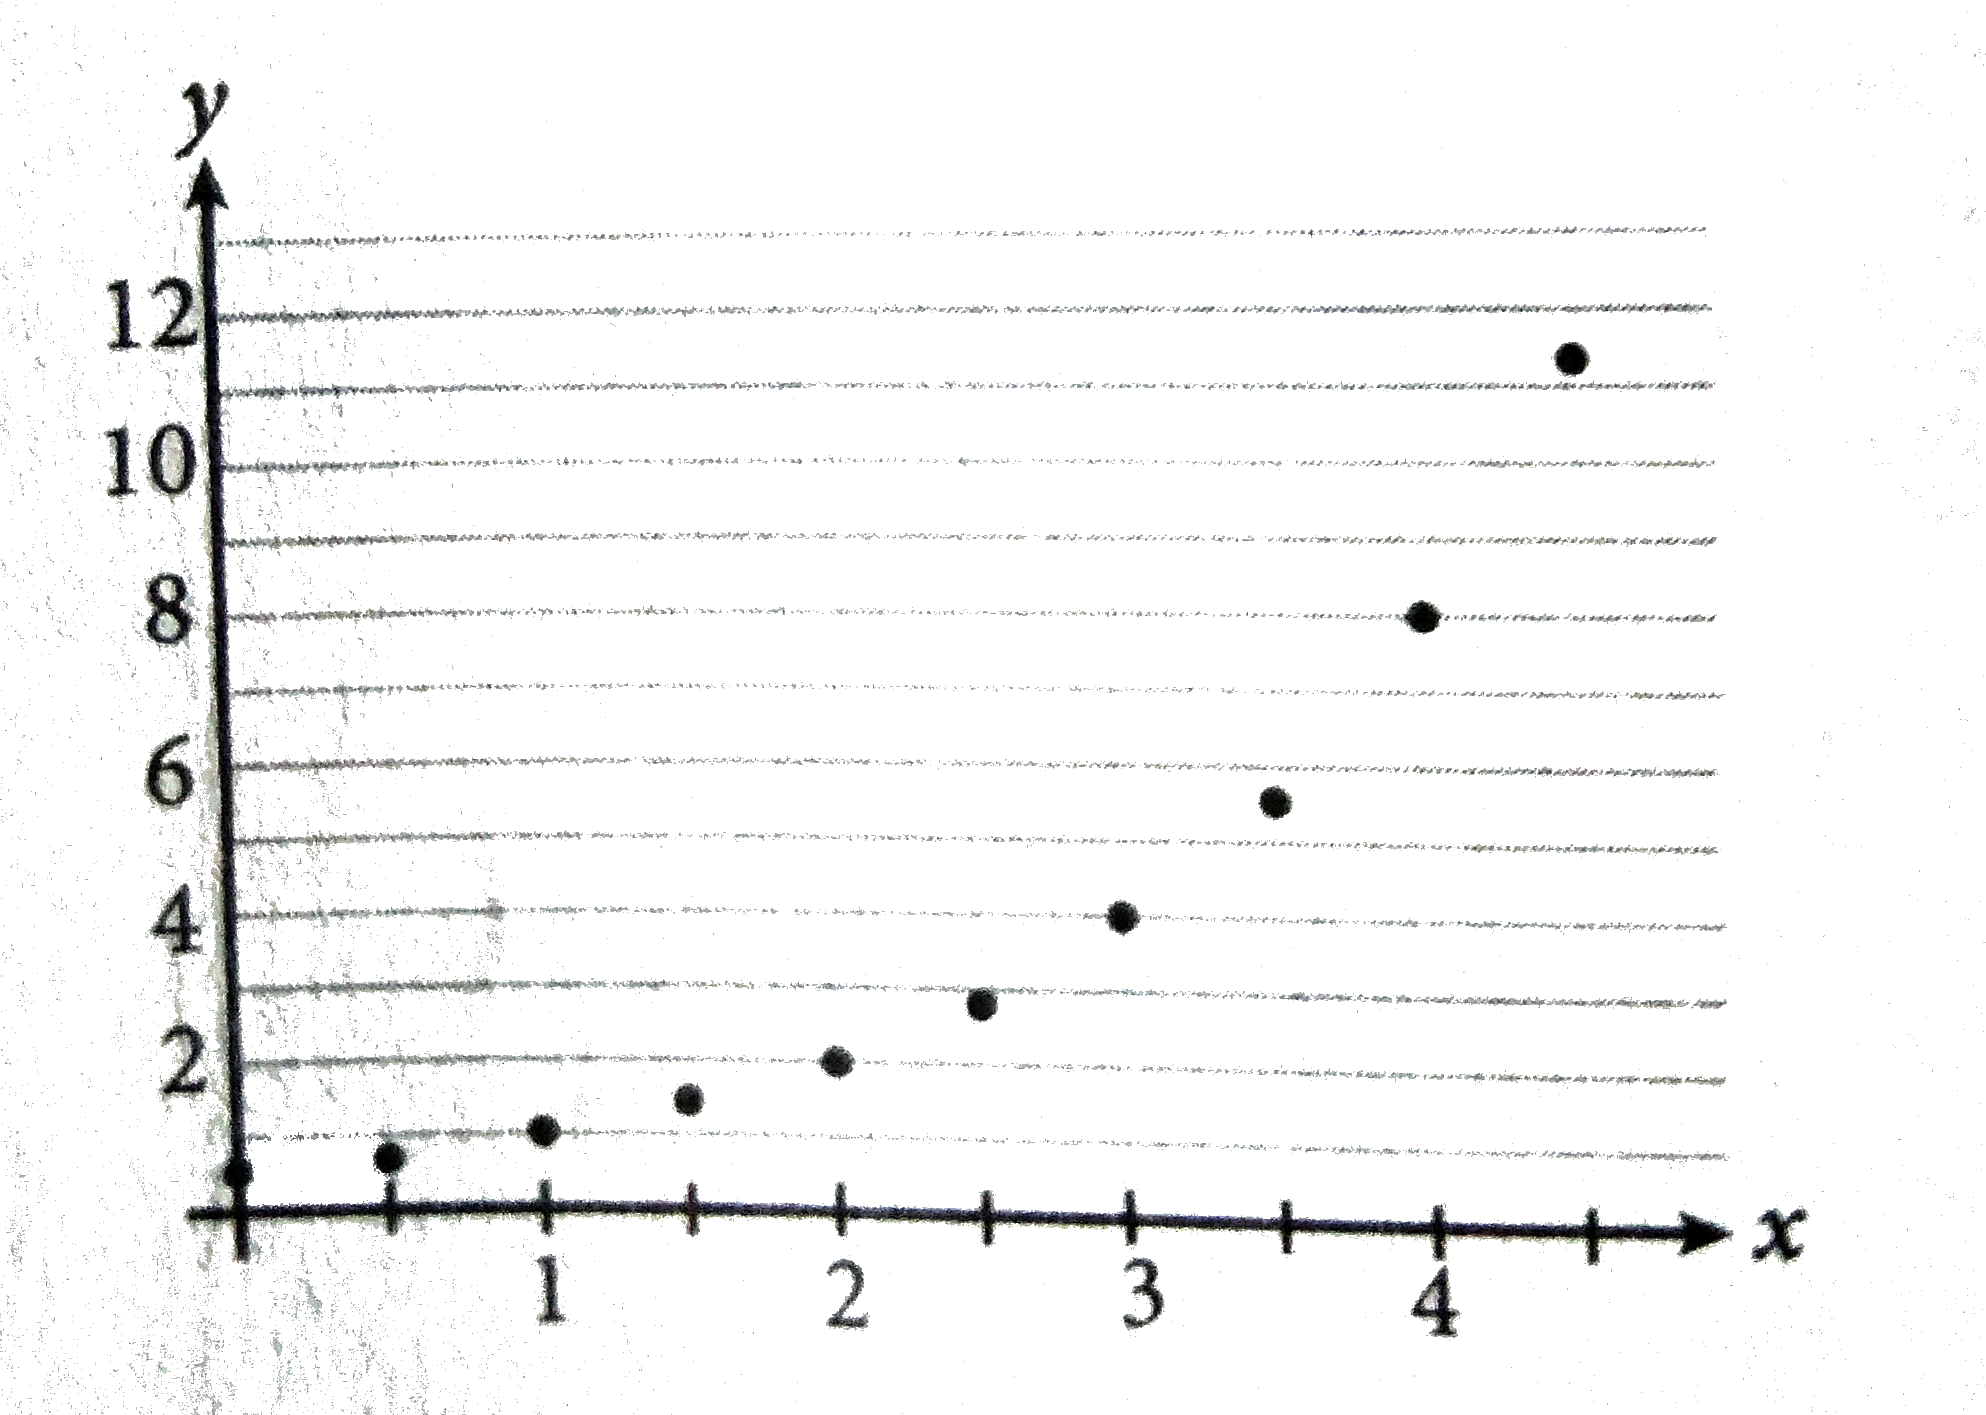
When water is heated in a closed system, the vapor pressure increase slowly at first and then more rapidly. As the water reaches the boiling point of 100∘C, the vapor pressure reaches 1 atm, known as 1 standard atmosphere. Which of the following models best describes the increase in vapor pressure as water is heated to its boiling point?View SolutionQuestion 7
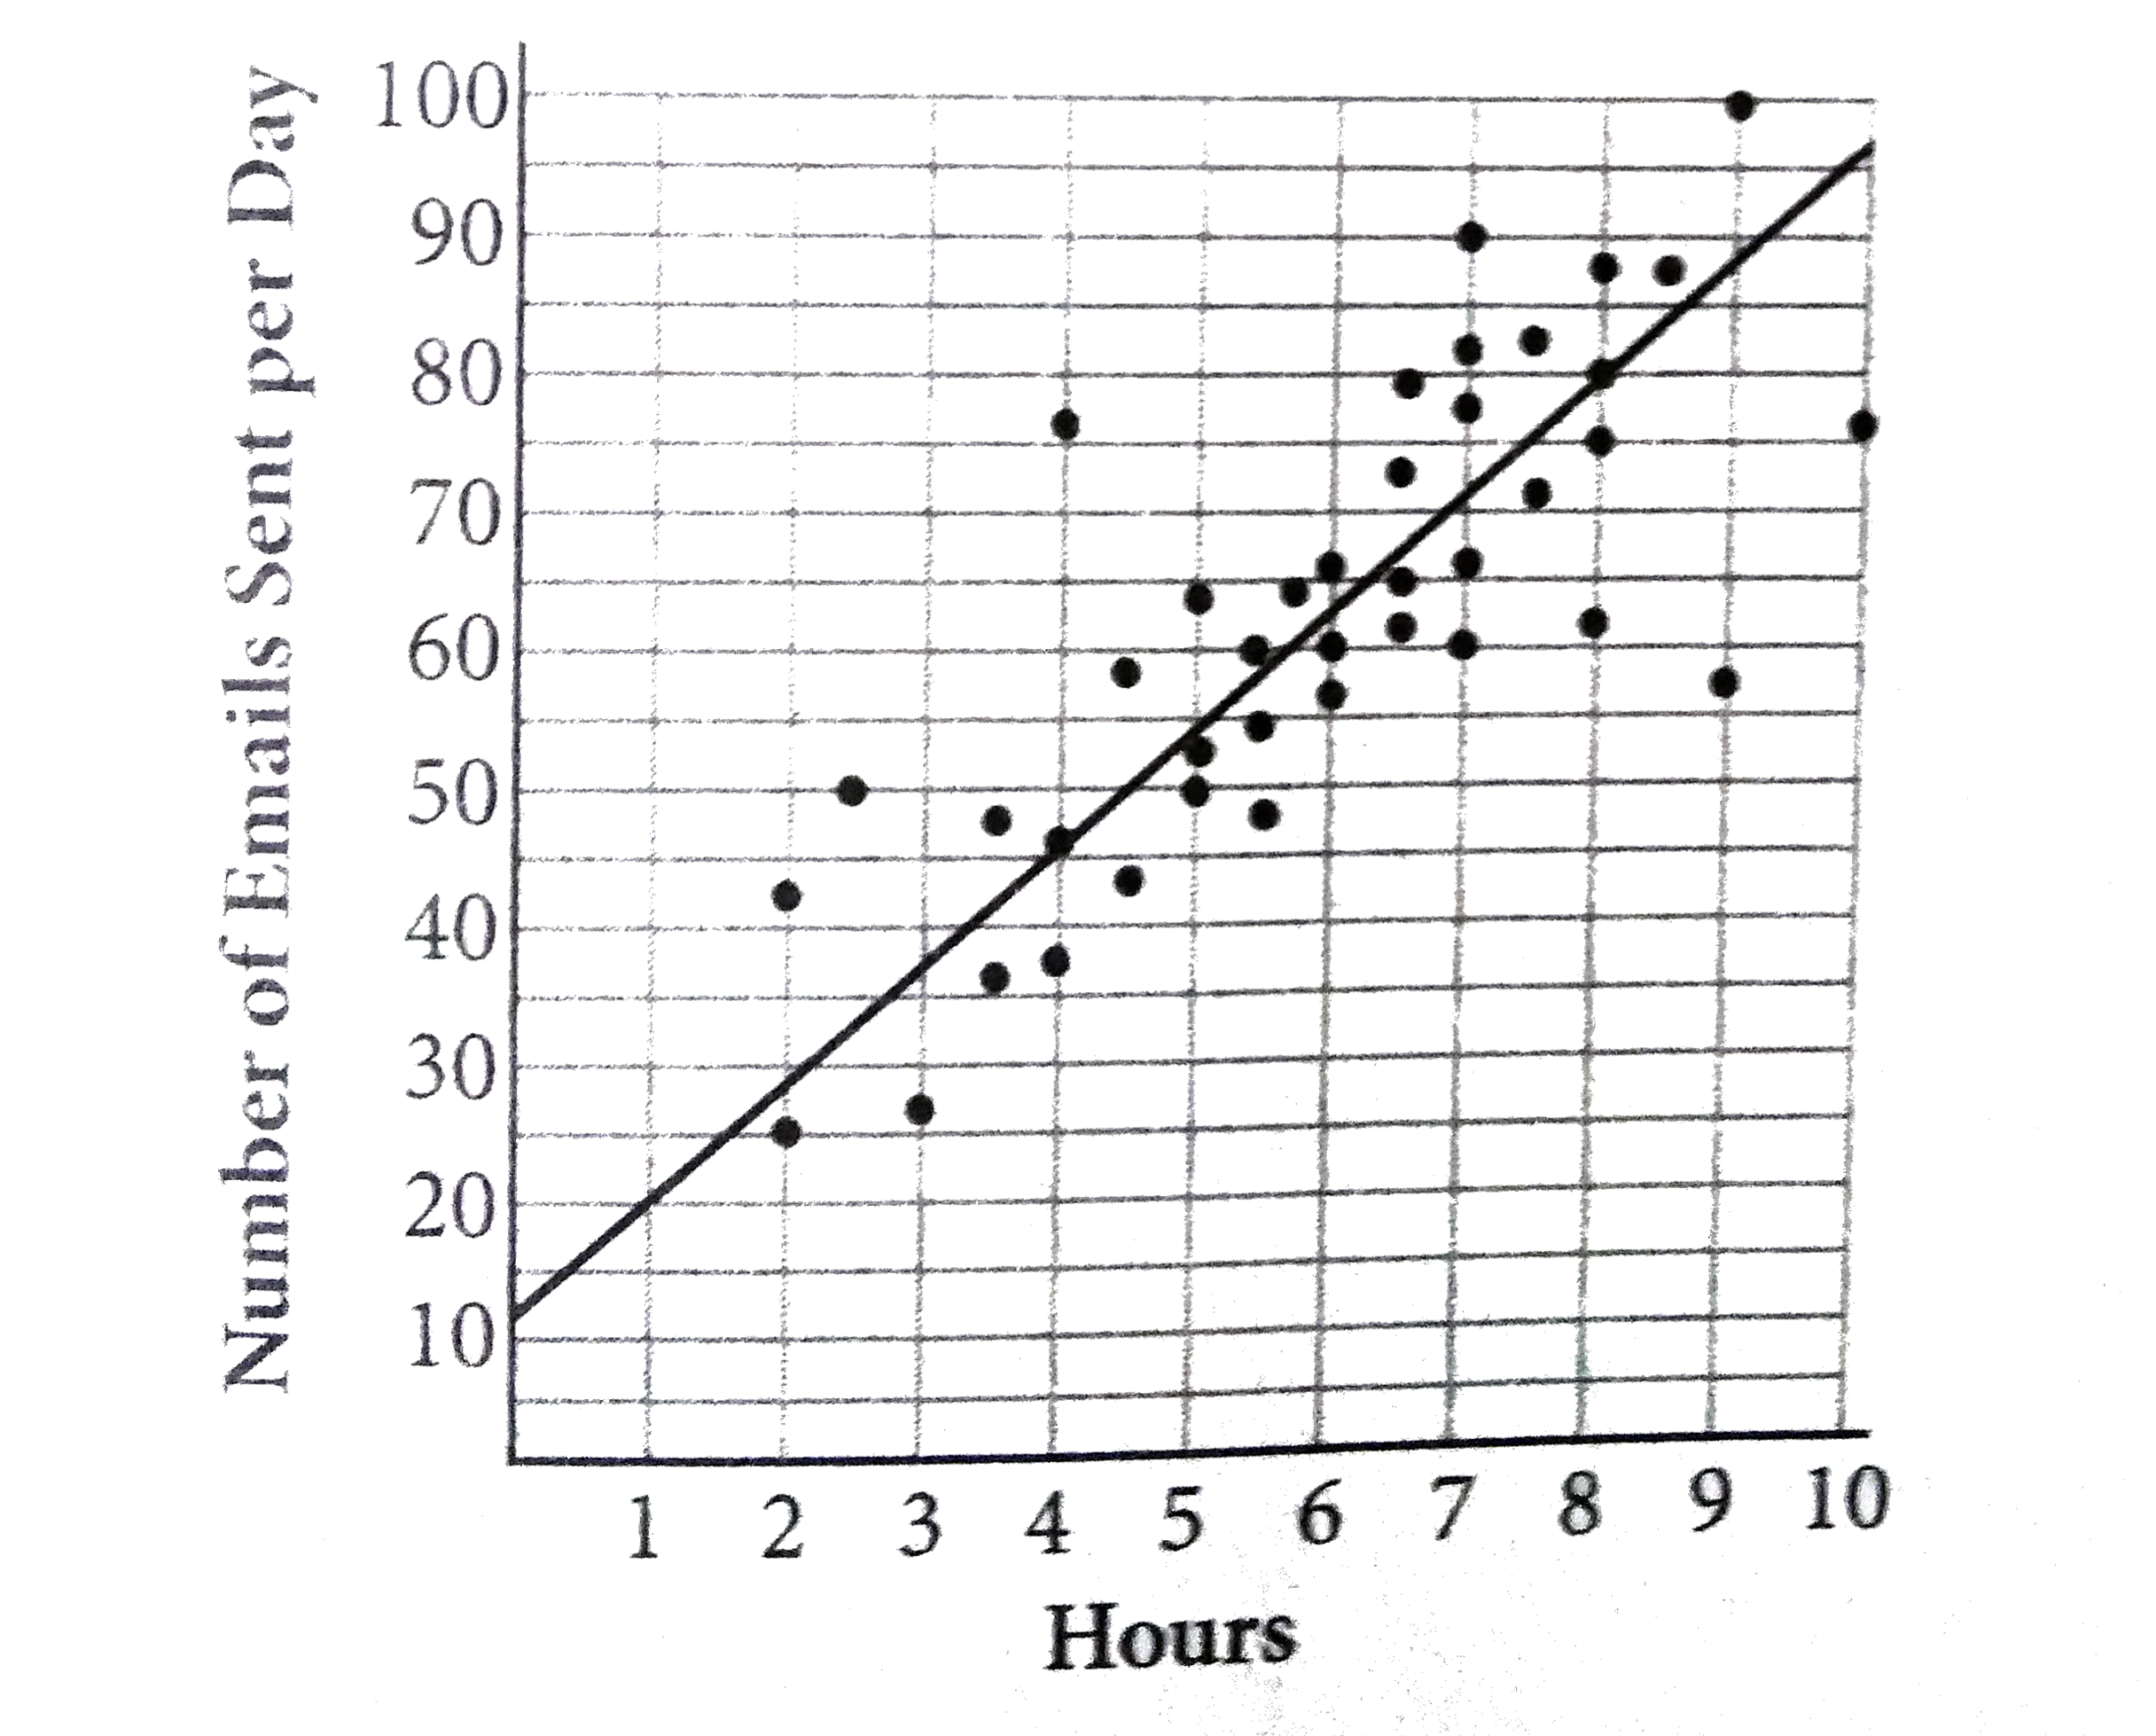
The figure above shows the number of emails sent per day plotted against the number of hours an adult works on a computer per day. Which of the following best estimates the average rate of change in the number of emails sent compared to the number of hours working on a computer?View SolutionQuestion 8
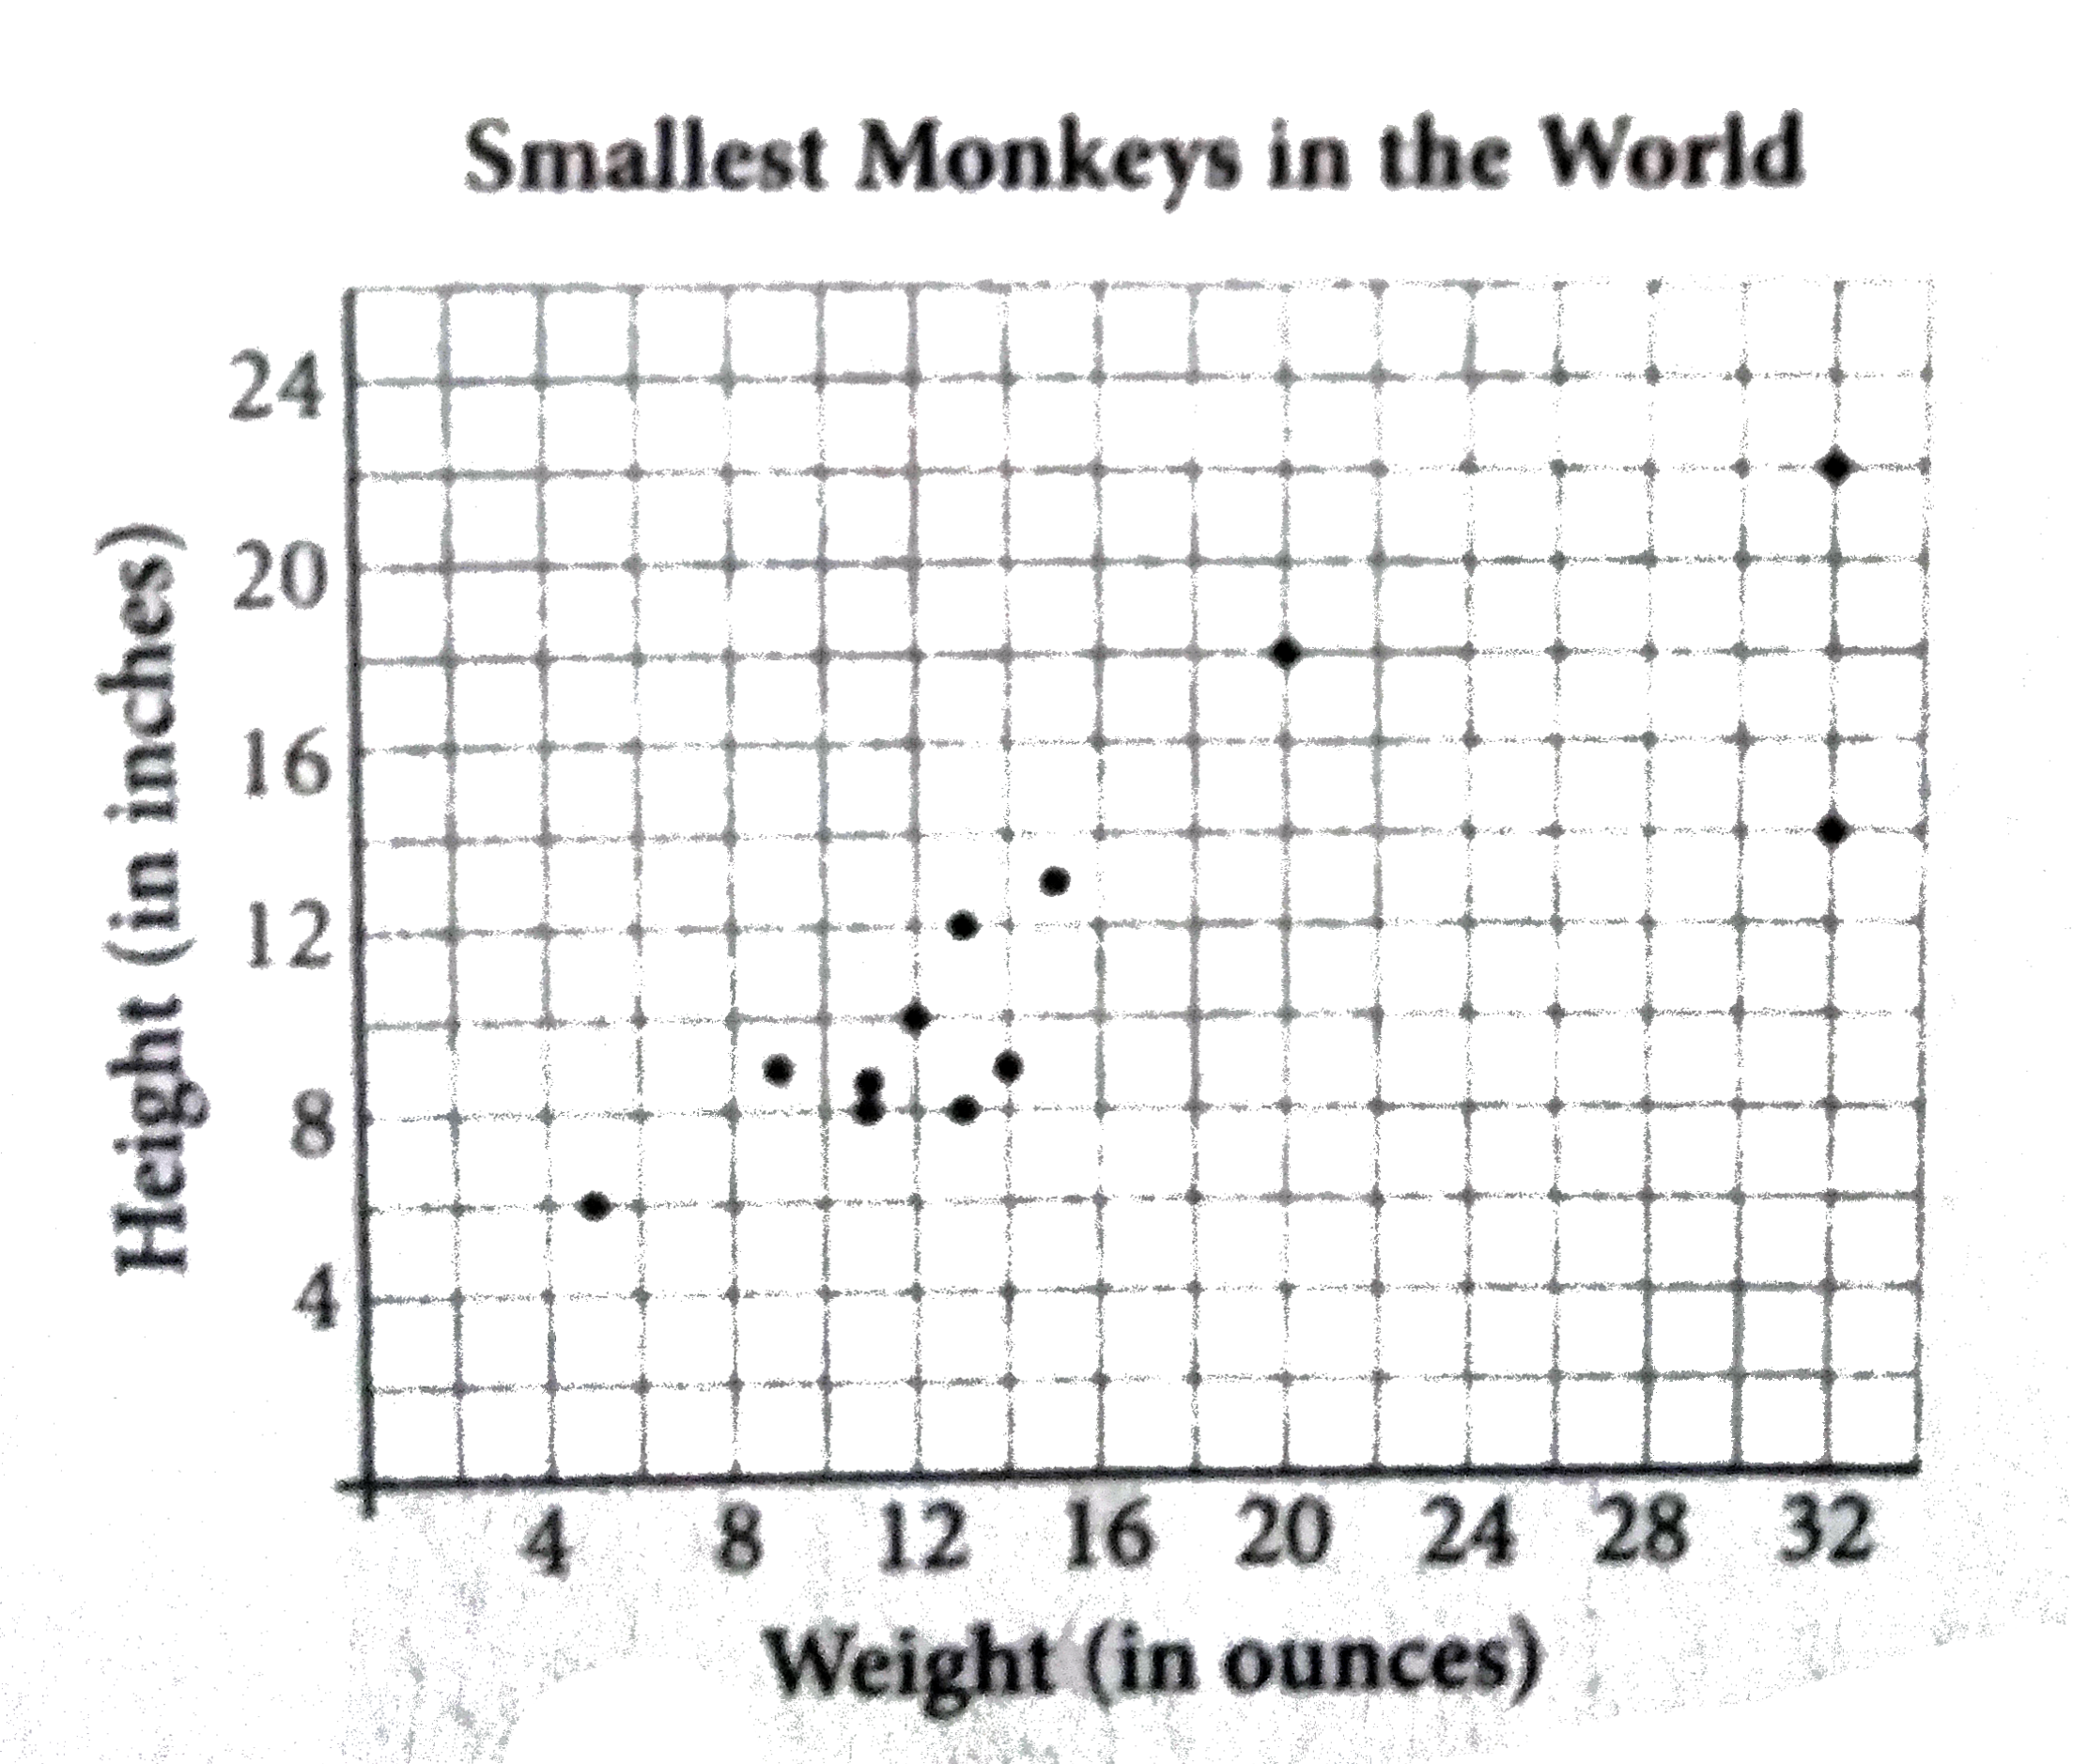
There are more than 250 known species of monkeys in the world. The scatterplot above shows the average height and weight of 12 species of particularly small monkeys, most of the which live in the Amazon Basin of South America. What is the height, in inches, of the monkeys represented by the data point that is farthest from the line of best fit (not shown)? View SolutionQuestion 10
Sea ice extent is a measurement of the area of ocean with at least 15% sea ice. The graph below shows data for the extent of Artic sea ice between 2000 and 2012 as reported by the National Snow and Ice Data Center. The line of best fit is also shown. The equations of the line is A(t)=−0.187t+380.5, where A(t) represents the area of measurement sea ice in the Artic Ocean in the year t.
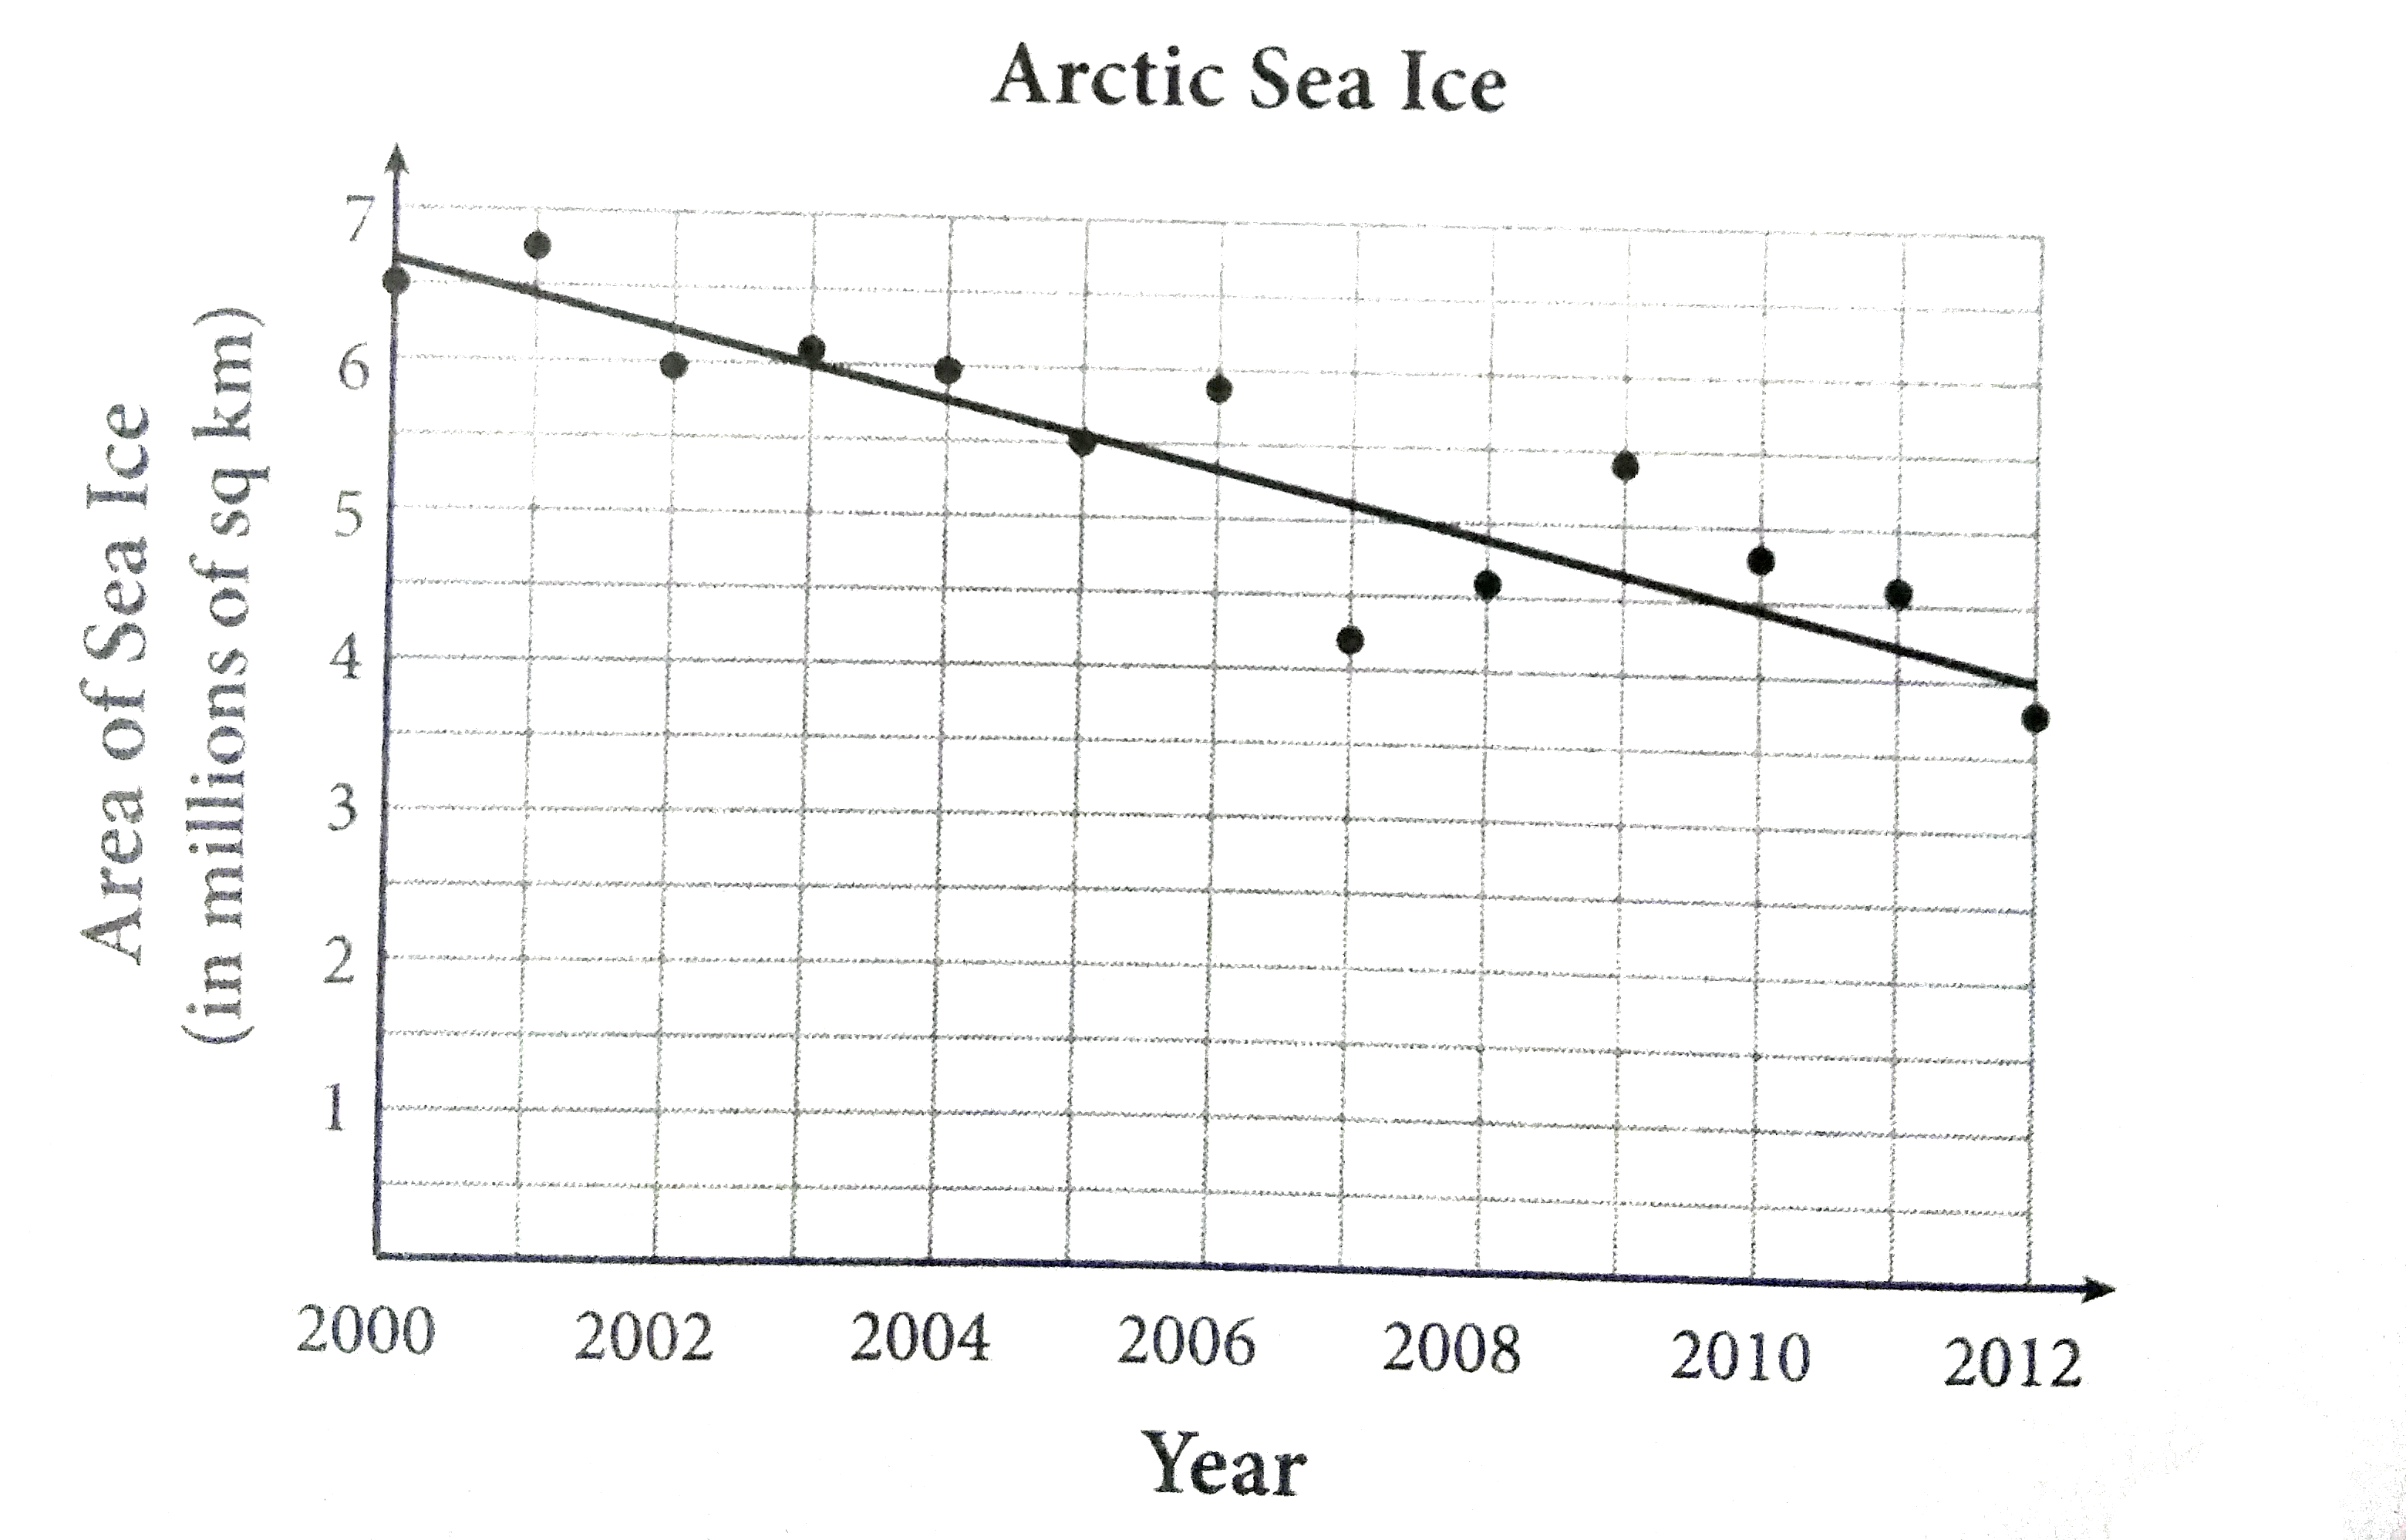
Q. Based on the equation of the line of best fit, which of the following statements accurately of measurable Arctic sea ice during the given times period?View SolutionQuestion 11
Sea ice extent is a measurement of the area of ocean with at least 15% sea ice. The graph below shows data for the extent of Artic sea ice between 2000 and 2012 as reported by the National Snow and Ice Data Center. The line of best fit is also shown. The equations of the line is A(t)=−0.187t+380.5, where A(t) represents the area of measurement sea ice in the Artic Ocean in the year t.

Q. Assuming the trand of the data continues, what is the predicted area, in millions of square kilometers, of measurable Arctic sea ice in the year 2020?View SolutionQuestion 12
Sea ice extent is a measurement of the area of ocean with at least 15% sea ice. The graph below shows data for the extent of Artic sea ice between 2000 and 2012 as reported by the National Snow and Ice Data Center. The line of best fit is also shown. The equations of the line is A(t)=−0.187t+380.5, where A(t) represents the area of measurement sea ice in the Artic Ocean in the year t.
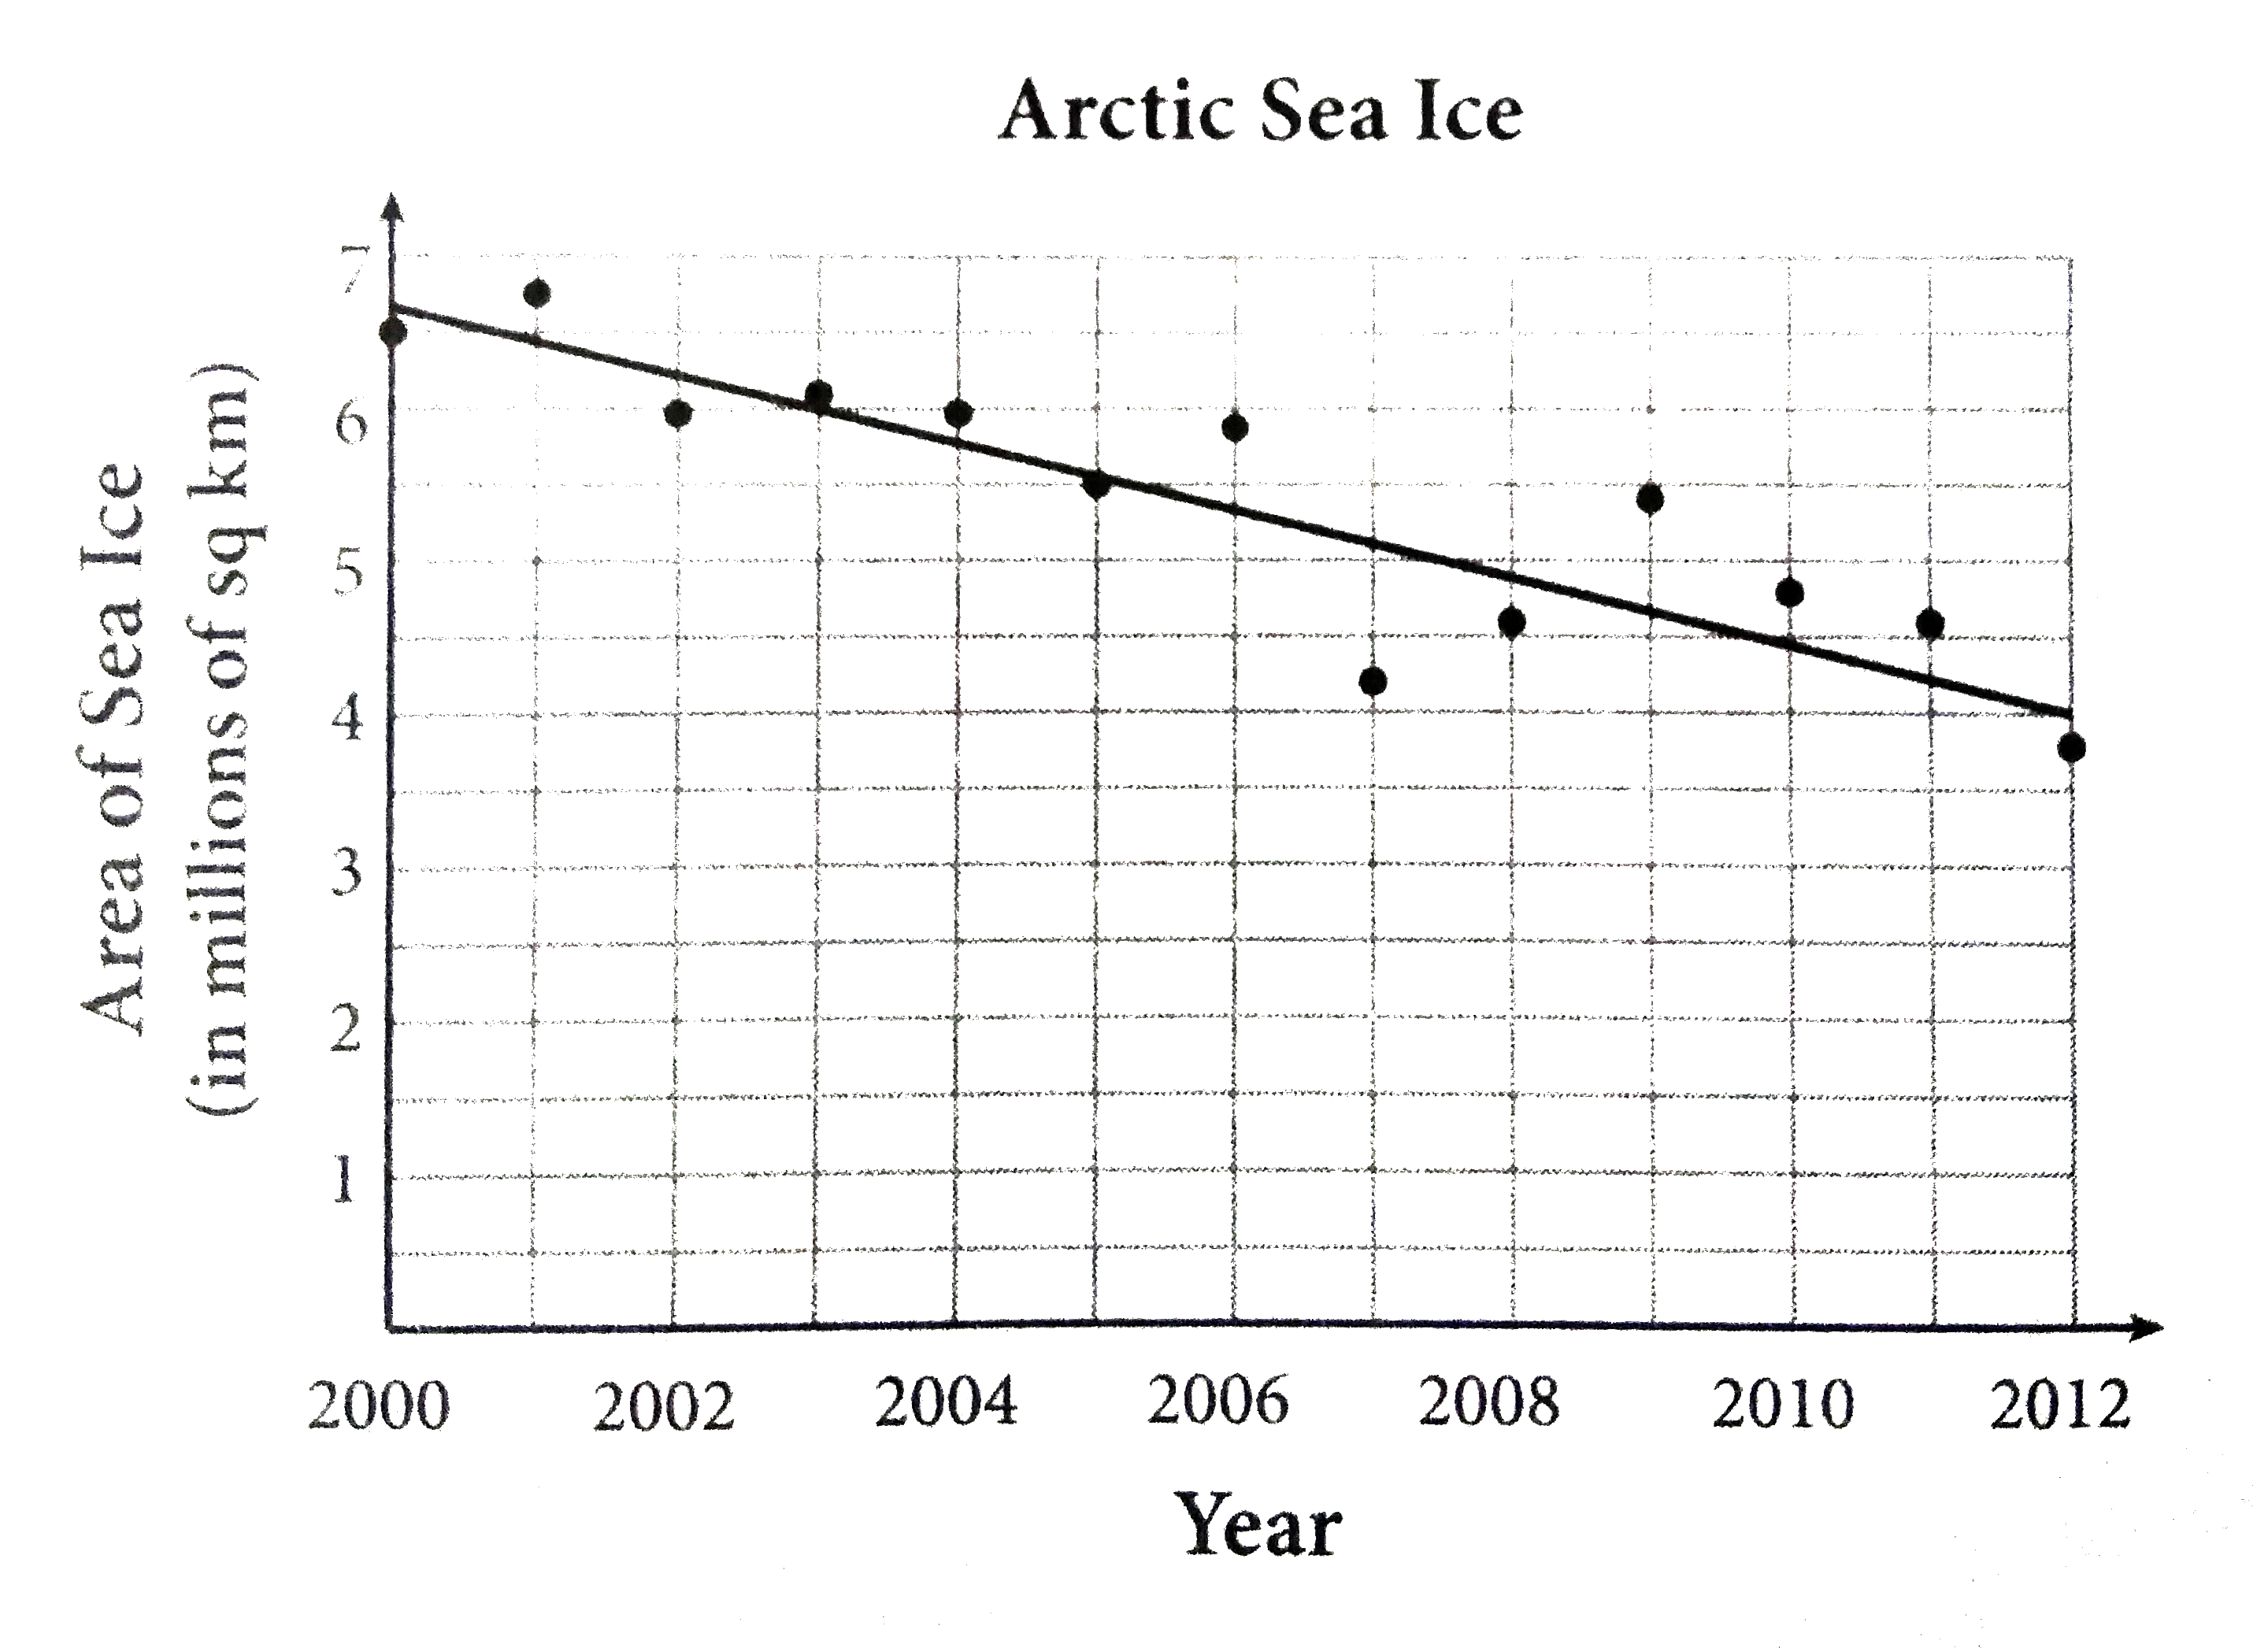
Q. Assuming the trend of the data continues in what year will the measurable sea ice in the Arctic Ocean cease to exist?View SolutionQuestion 13
A dietician working in the childrens ward at a hospital is monitoring the water intake of all the patients in the ward. The total water intake for each patient is recorded throughout the day and then averaged over the 24-hour period. The results are recorded in the scatterplot, where each dot represents the average hourly water intake for one child.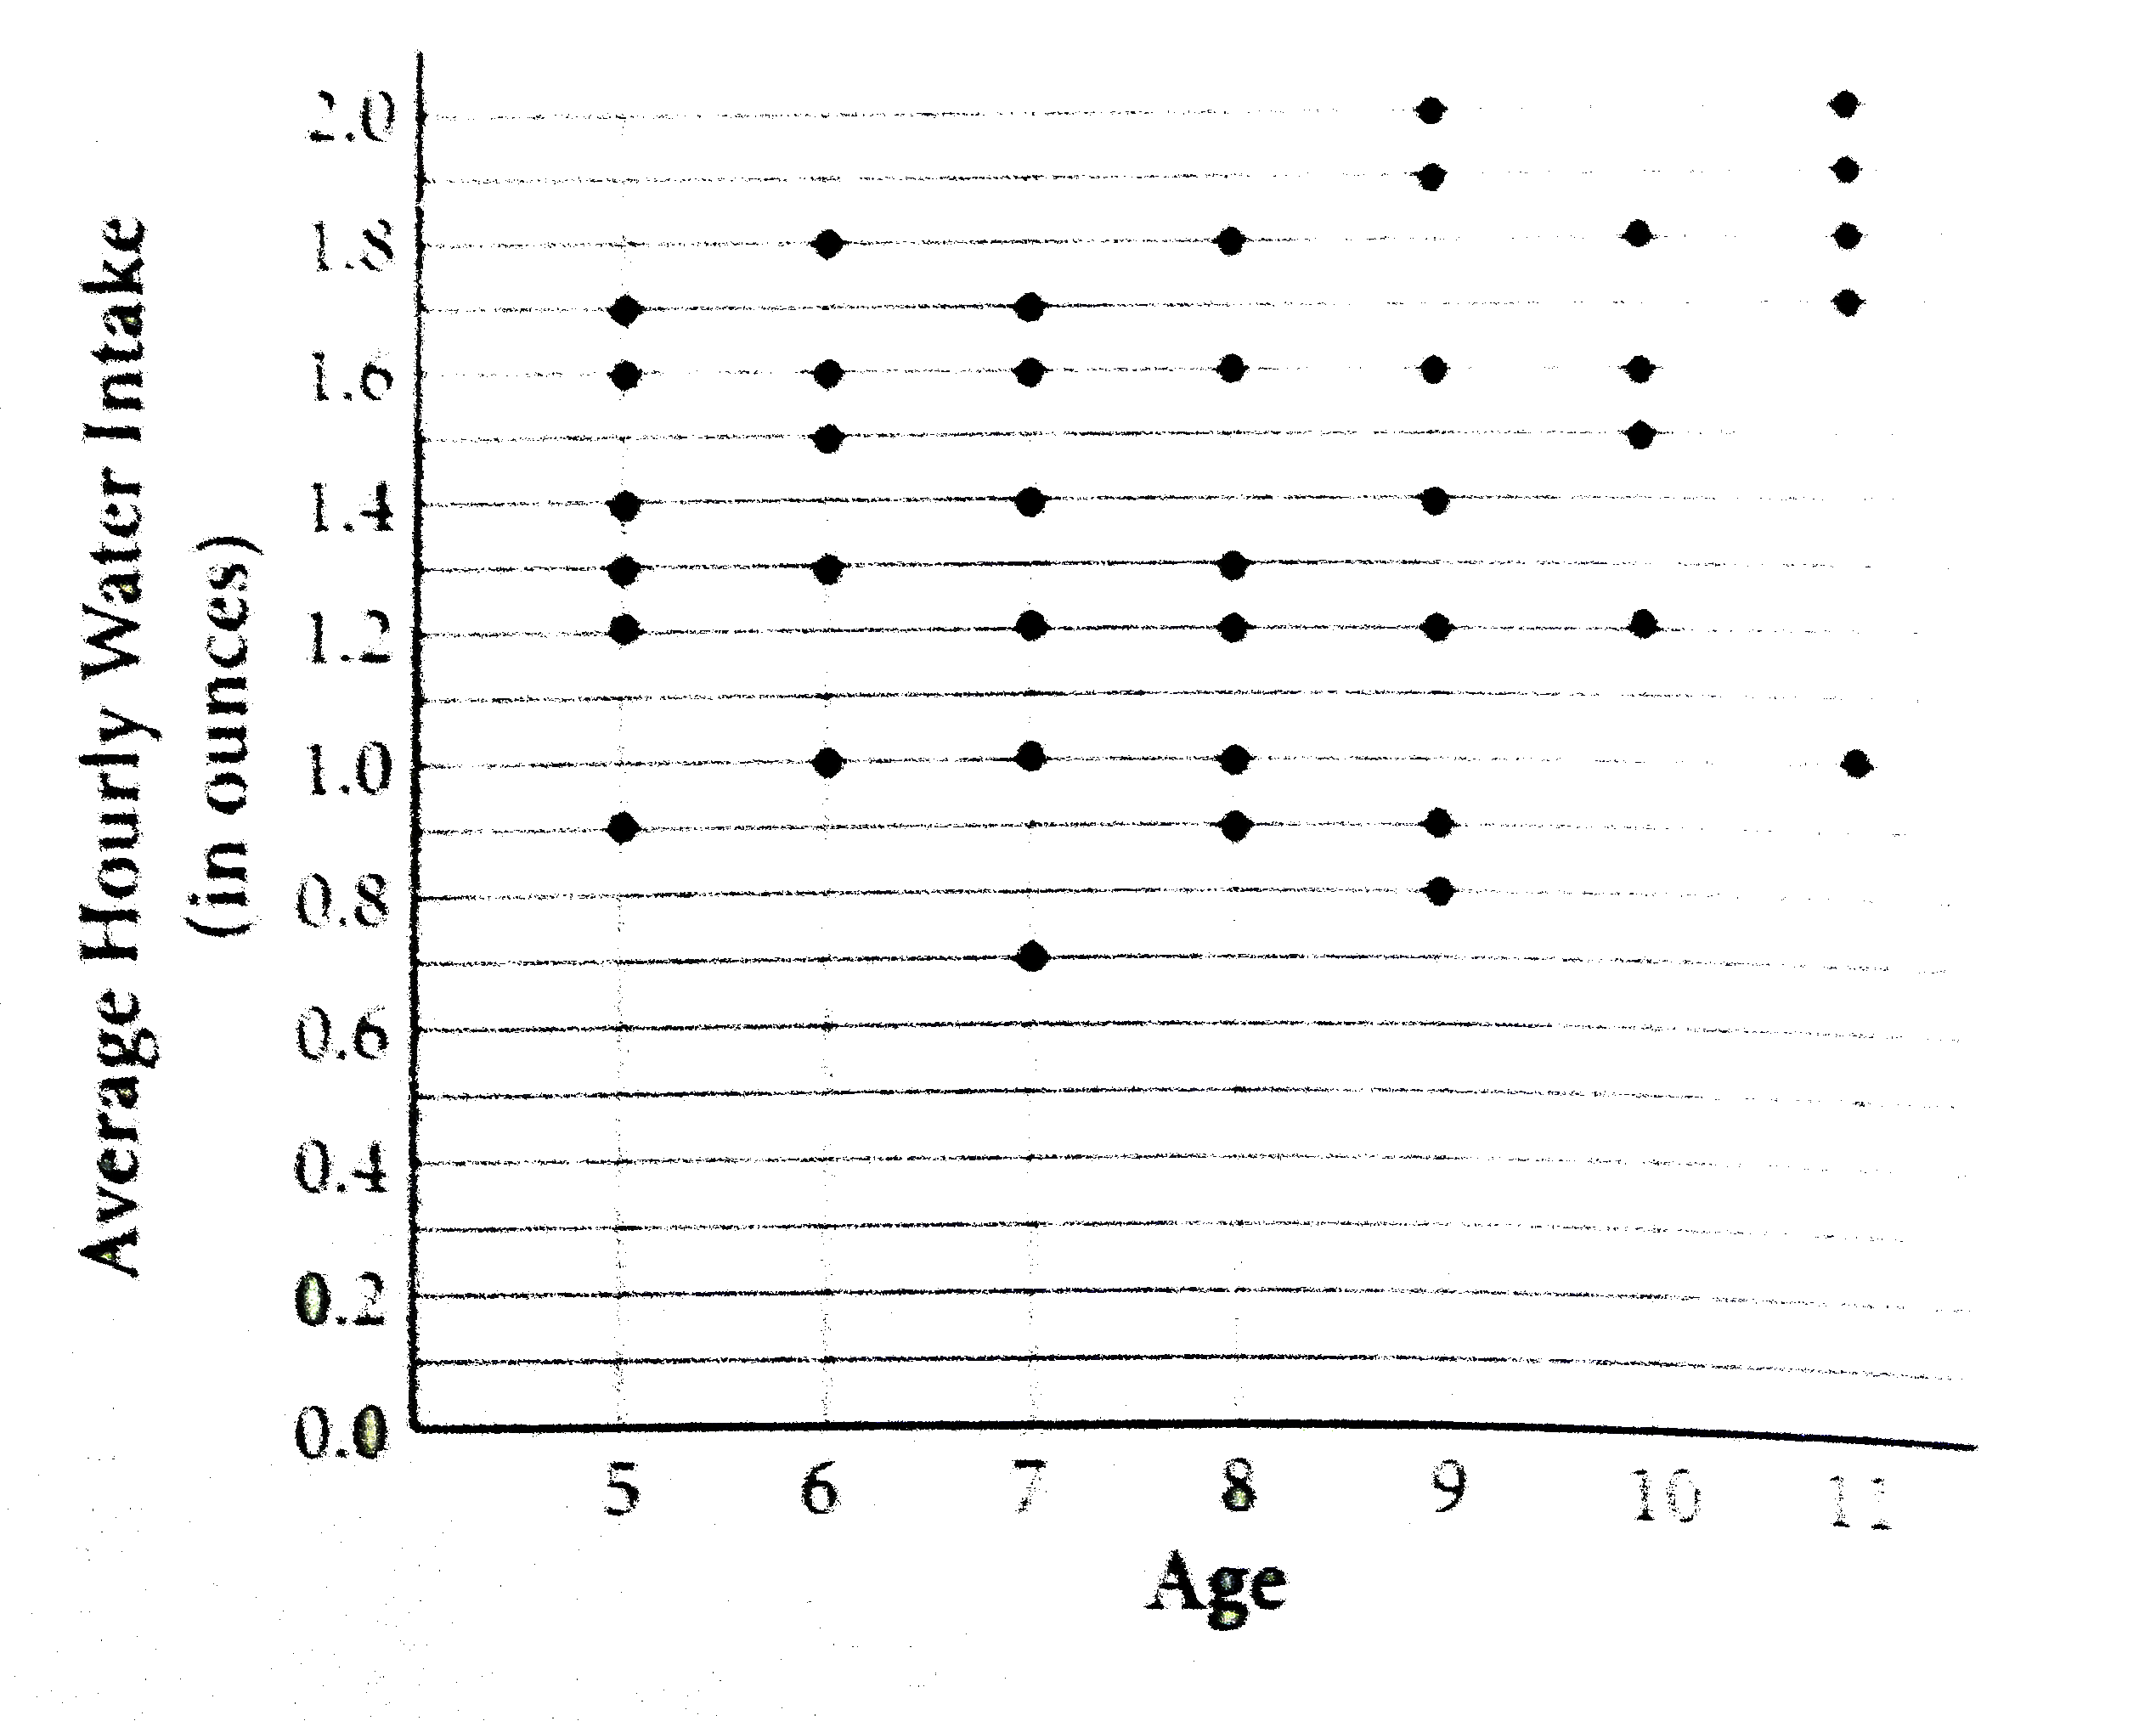
Q.Which of the following ages has the greatest range of values for the average hourly water intake?View SolutionQuestion 14
A dietician working in the childrens ward at a hospital is monitoring the water intake of all the patients in the ward. The total water intake for each patient is recorded throughout the day and then averaged over the 24-hour period. The results are recorded in the scatterplot, where each dot represents the average hourly water intake for one child.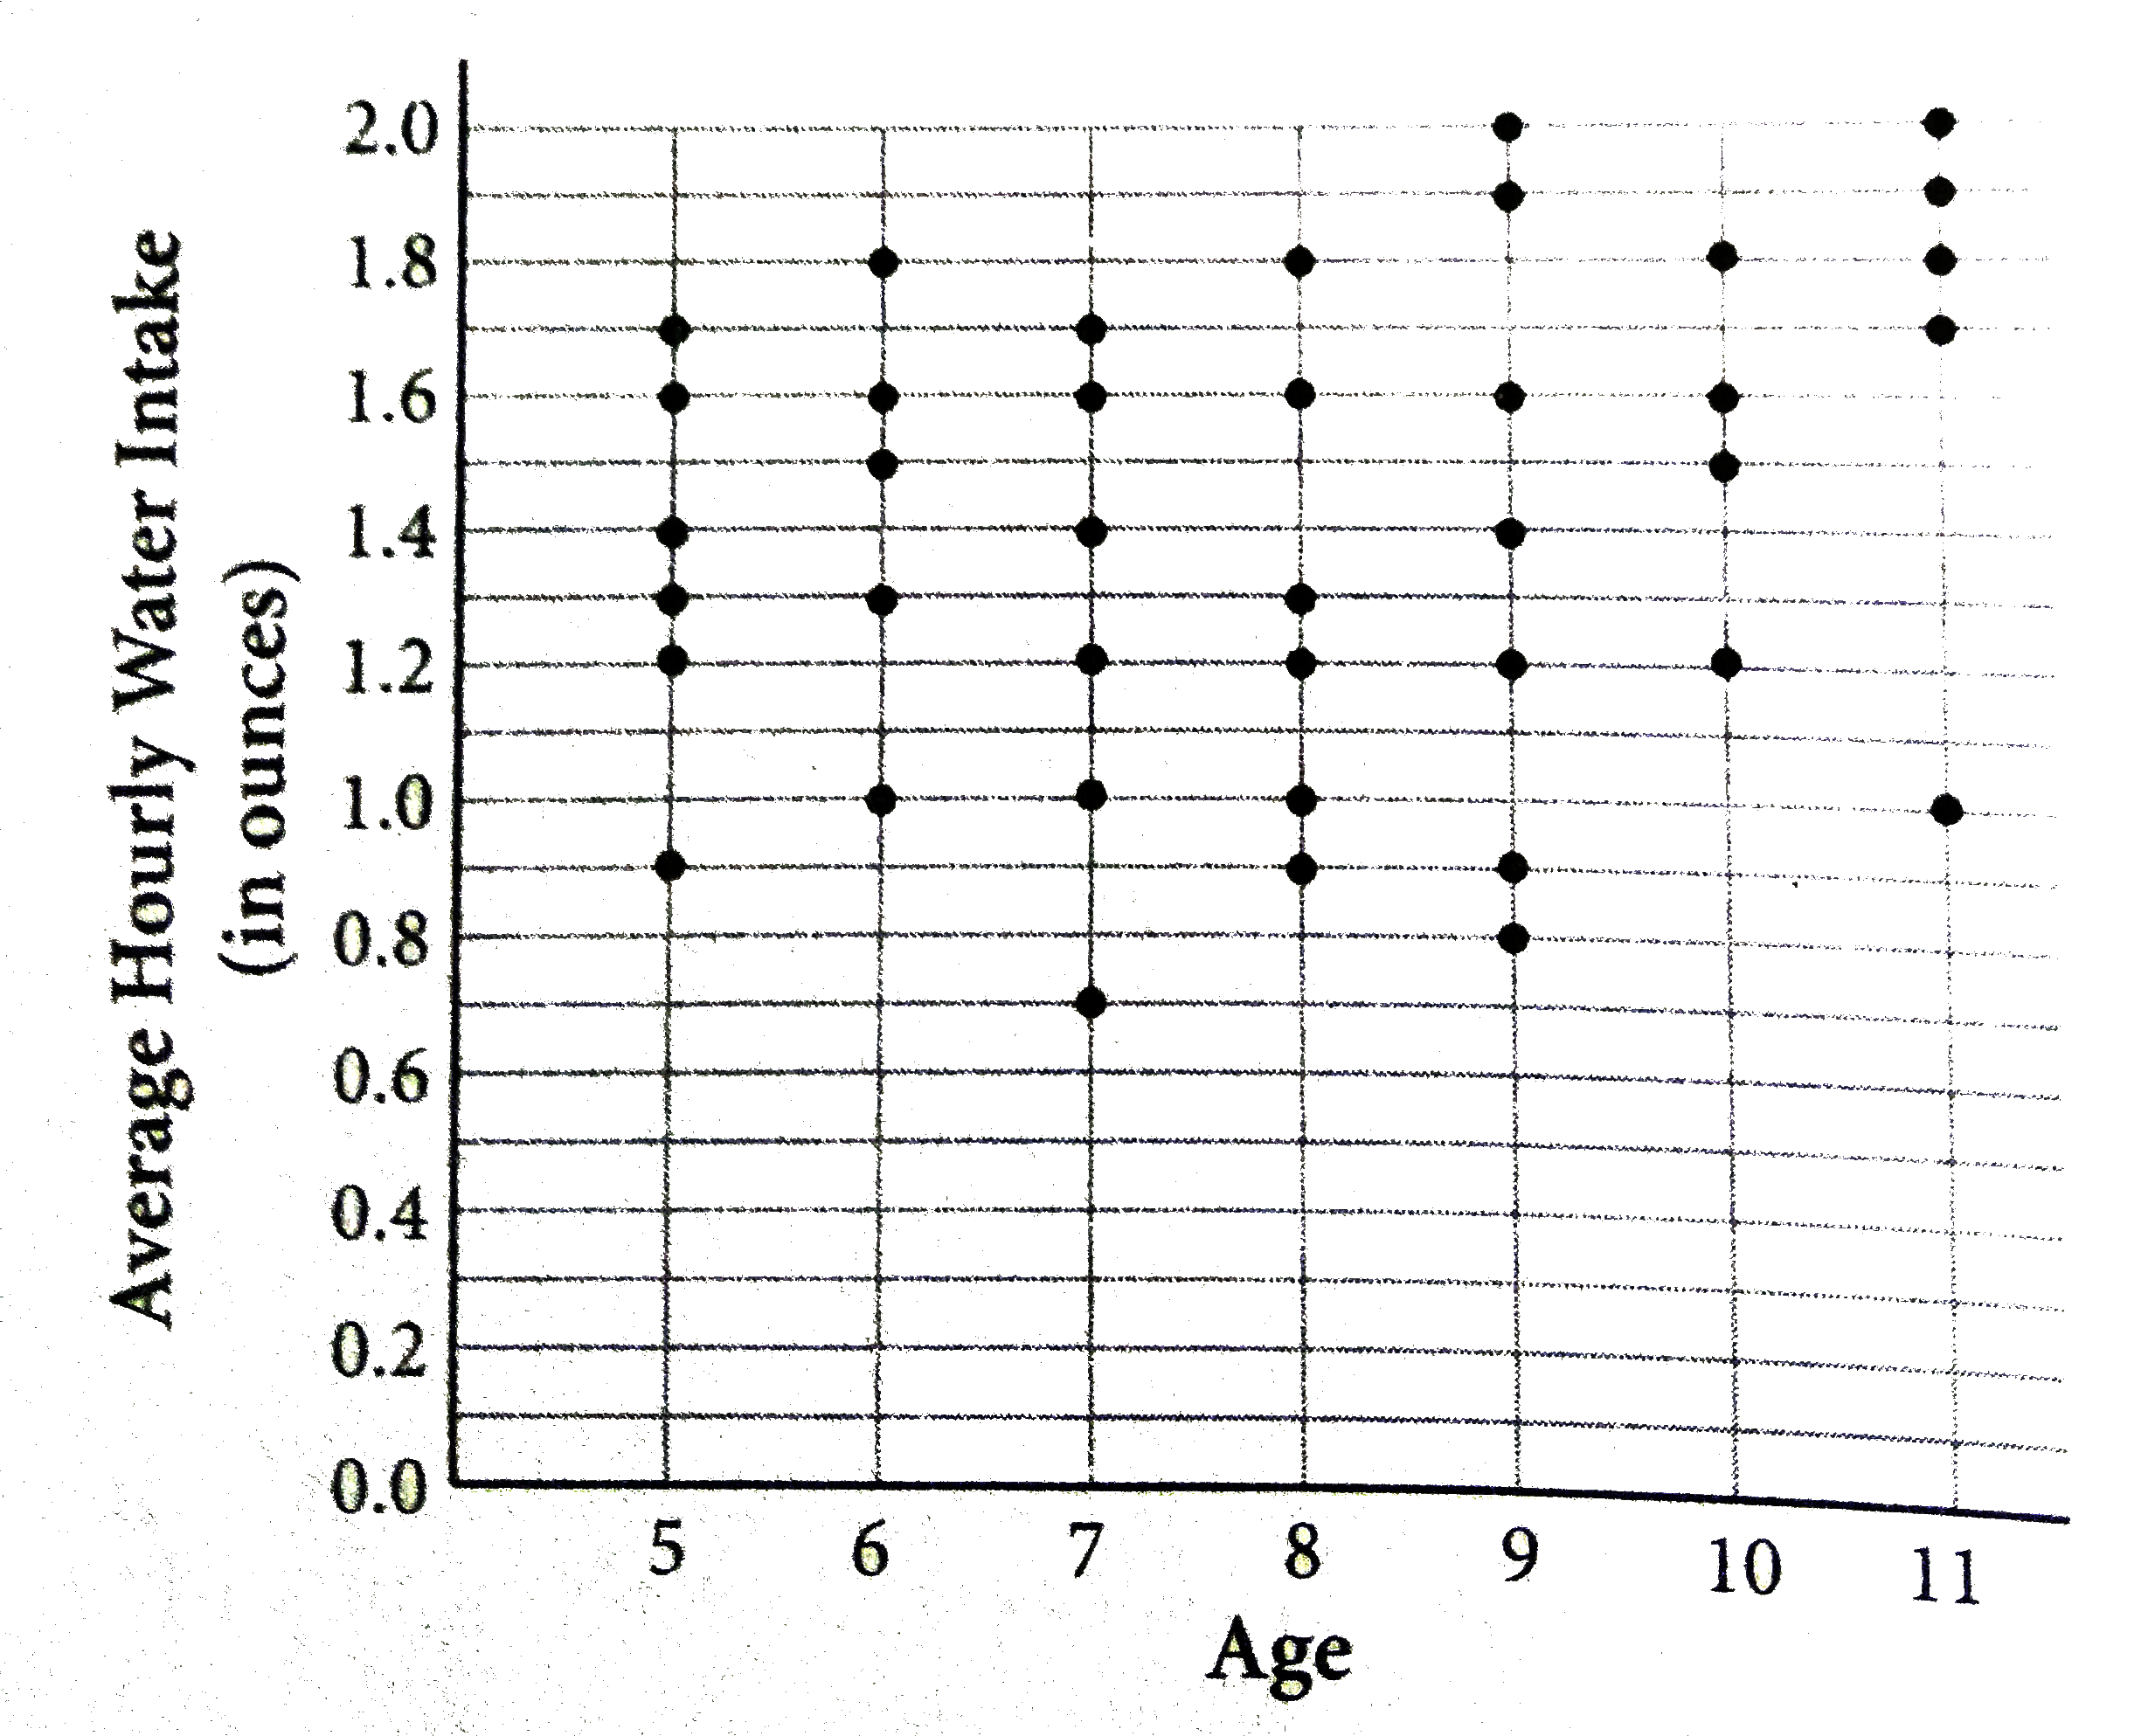
Q. A child between the ages of 5 and 8 should consume at least 1 liter of water per day. Based on the data presented in the scatterplot, what percent of the children, age 5-8, in the ward consumed less than the daily-recommended amount? (Note: There are 24 hours in one day and approximately 33.814 ounces is 1 liter.)View SolutionQuestion 15
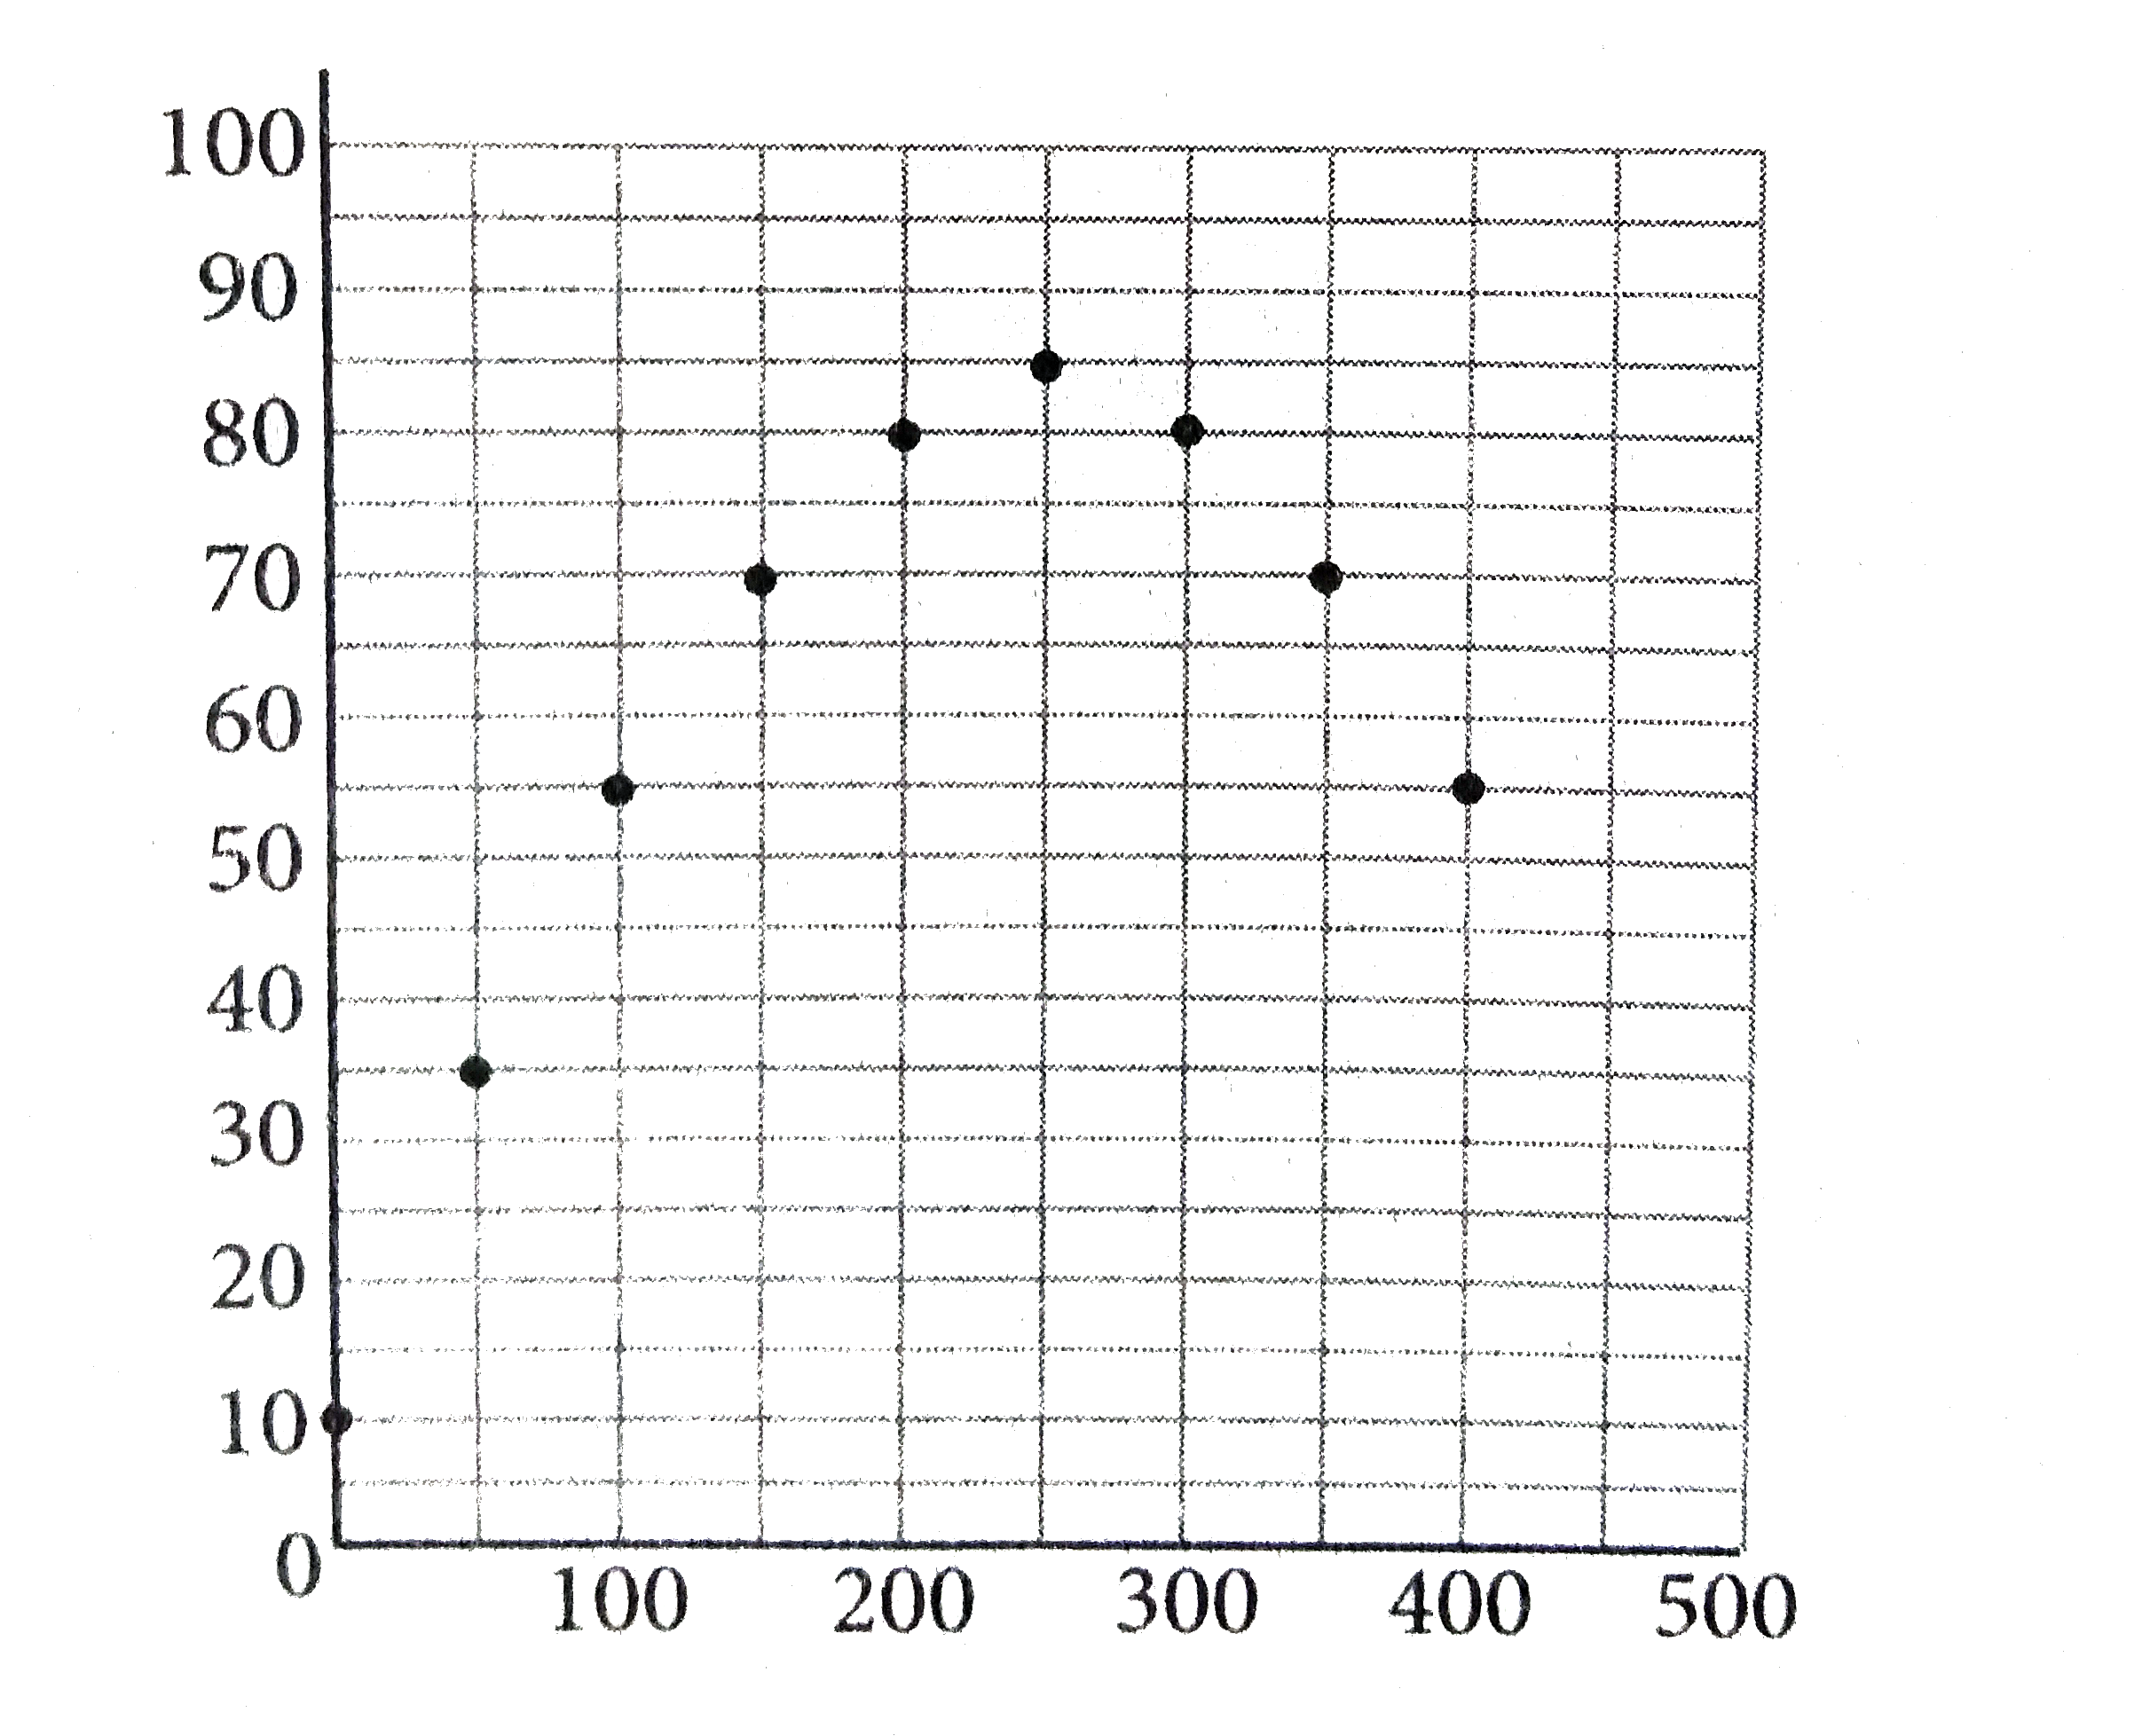
As the elevation above sea level increase, the corresponding air pressure decrease. A scatterplot comparing elevations, in feet, to air pressure, as a percent of sea level pressure, is shown balow.

Q. Elevations above 8,000 meters are said to be in the "death zone", a range of elevations in which oxygen levels are not high enough to sustain human life. What is the approximate air pressure (as a percent of sea level pressure) at the death zone threshold?( Note: 1 meter=3.28 feet)View SolutionQuestion 16
As the elevation above sea level increase, the corresponding air pressure decrease. A scatterplot comparing elevations, in feet, to air pressure, as a percent of sea level pressure, is shown balow.
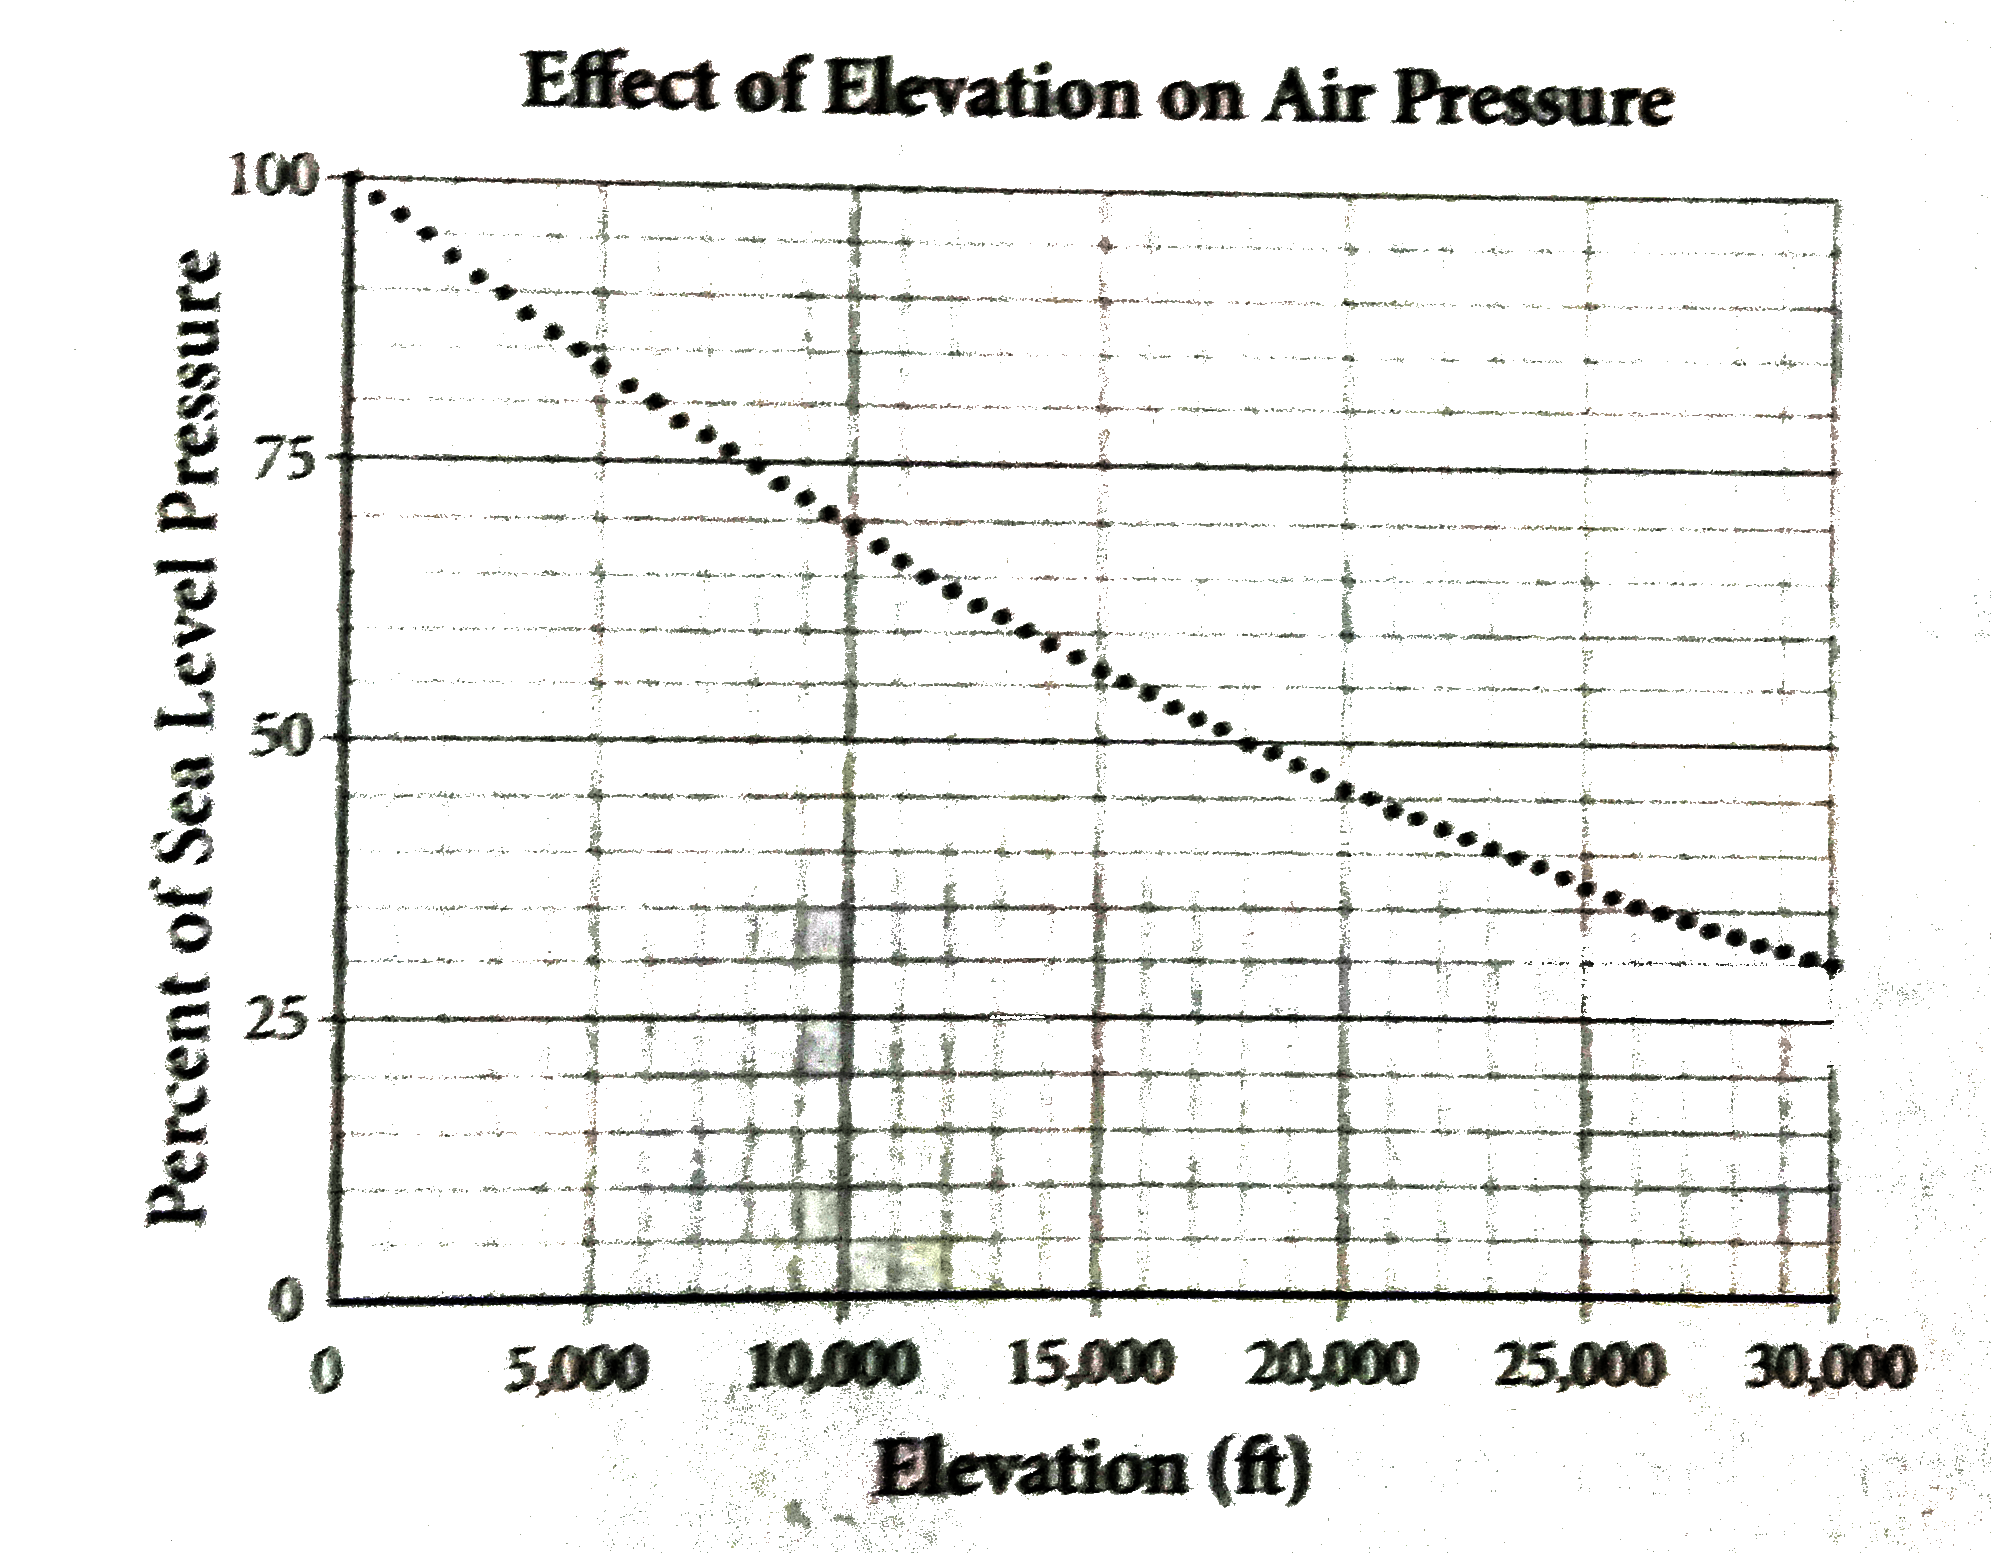
Q. Air pressure is sometimes measured in inches of mercury. If sea level air pressure measures as 29.2 inches of mercury, what is the approximate difference, in inches of mercury, between the pressure at sea level and the pressure at the death zone threshold?View Solution
