SHORT ANSWER TYPE QUESTION from PEARSON IIT JEE FOUNDATION STATISTICS for Class 6
| Class 6 | MATHS |
| Chapter | STATISTICS |
| PEARSON IIT JEE FOUNDATION | SHORT ANSWER TYPE QUESTION |
| Medium | English |
| Academic Year | 2023-2024 |
Question 3
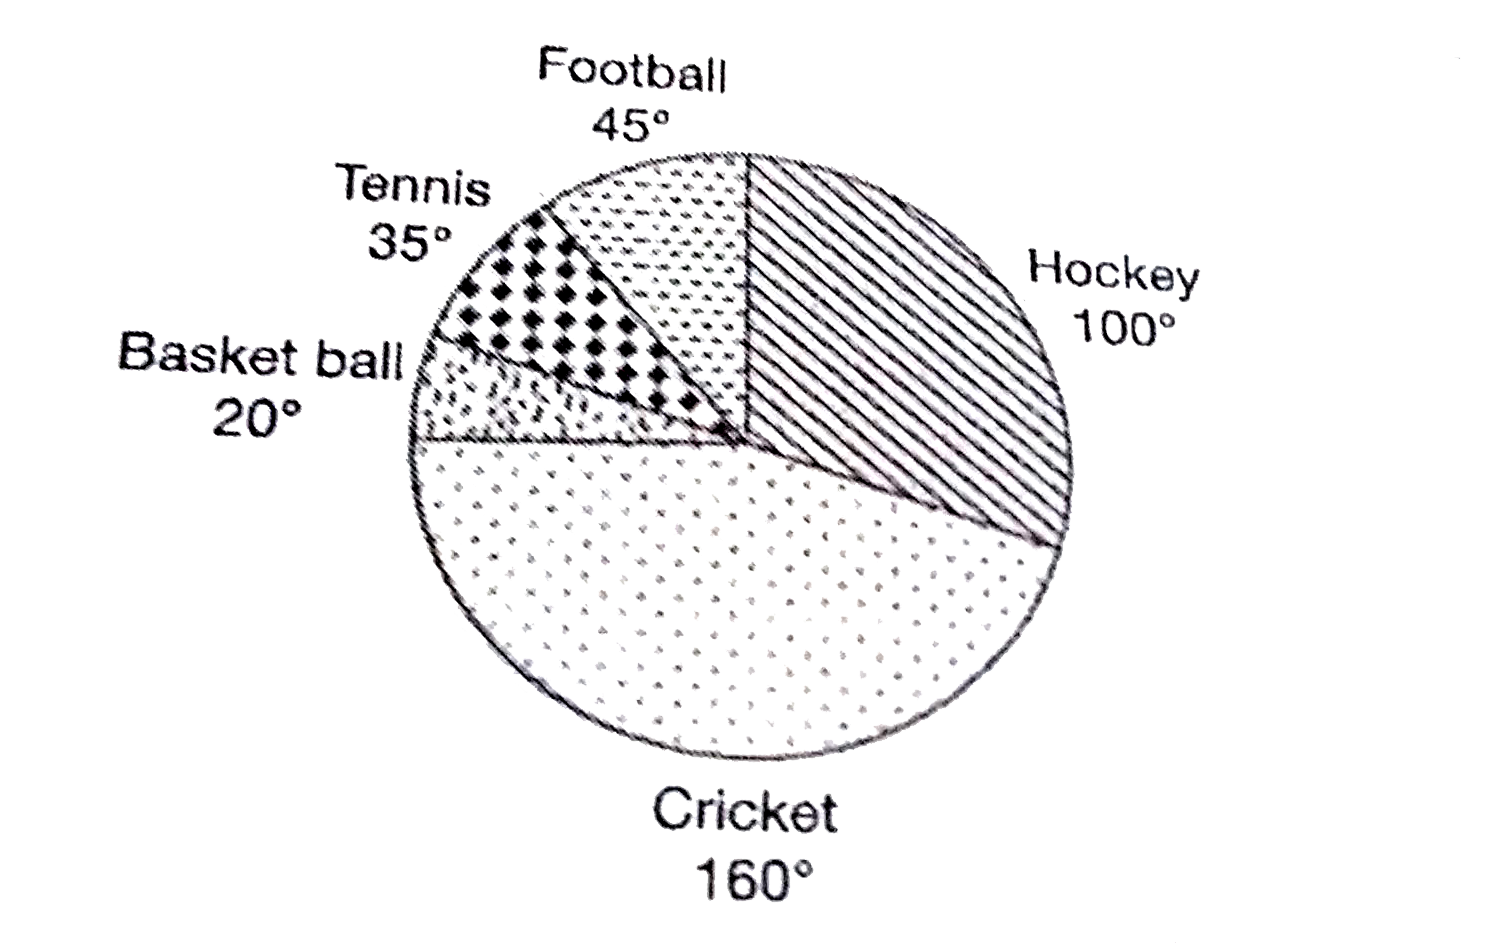
The given pie chart shows the amount of money spent by a school on various sports in the year 2015.

Study the pie chart carefully and answer the following question.
(i) If the amount spent on football was Rs. 9000, then how much more money was spent on hockey than on football ?
(ii) If the amount spent on football Rs. 9000, then what was the total amount spent on all sports ? View SolutionQuestion 4
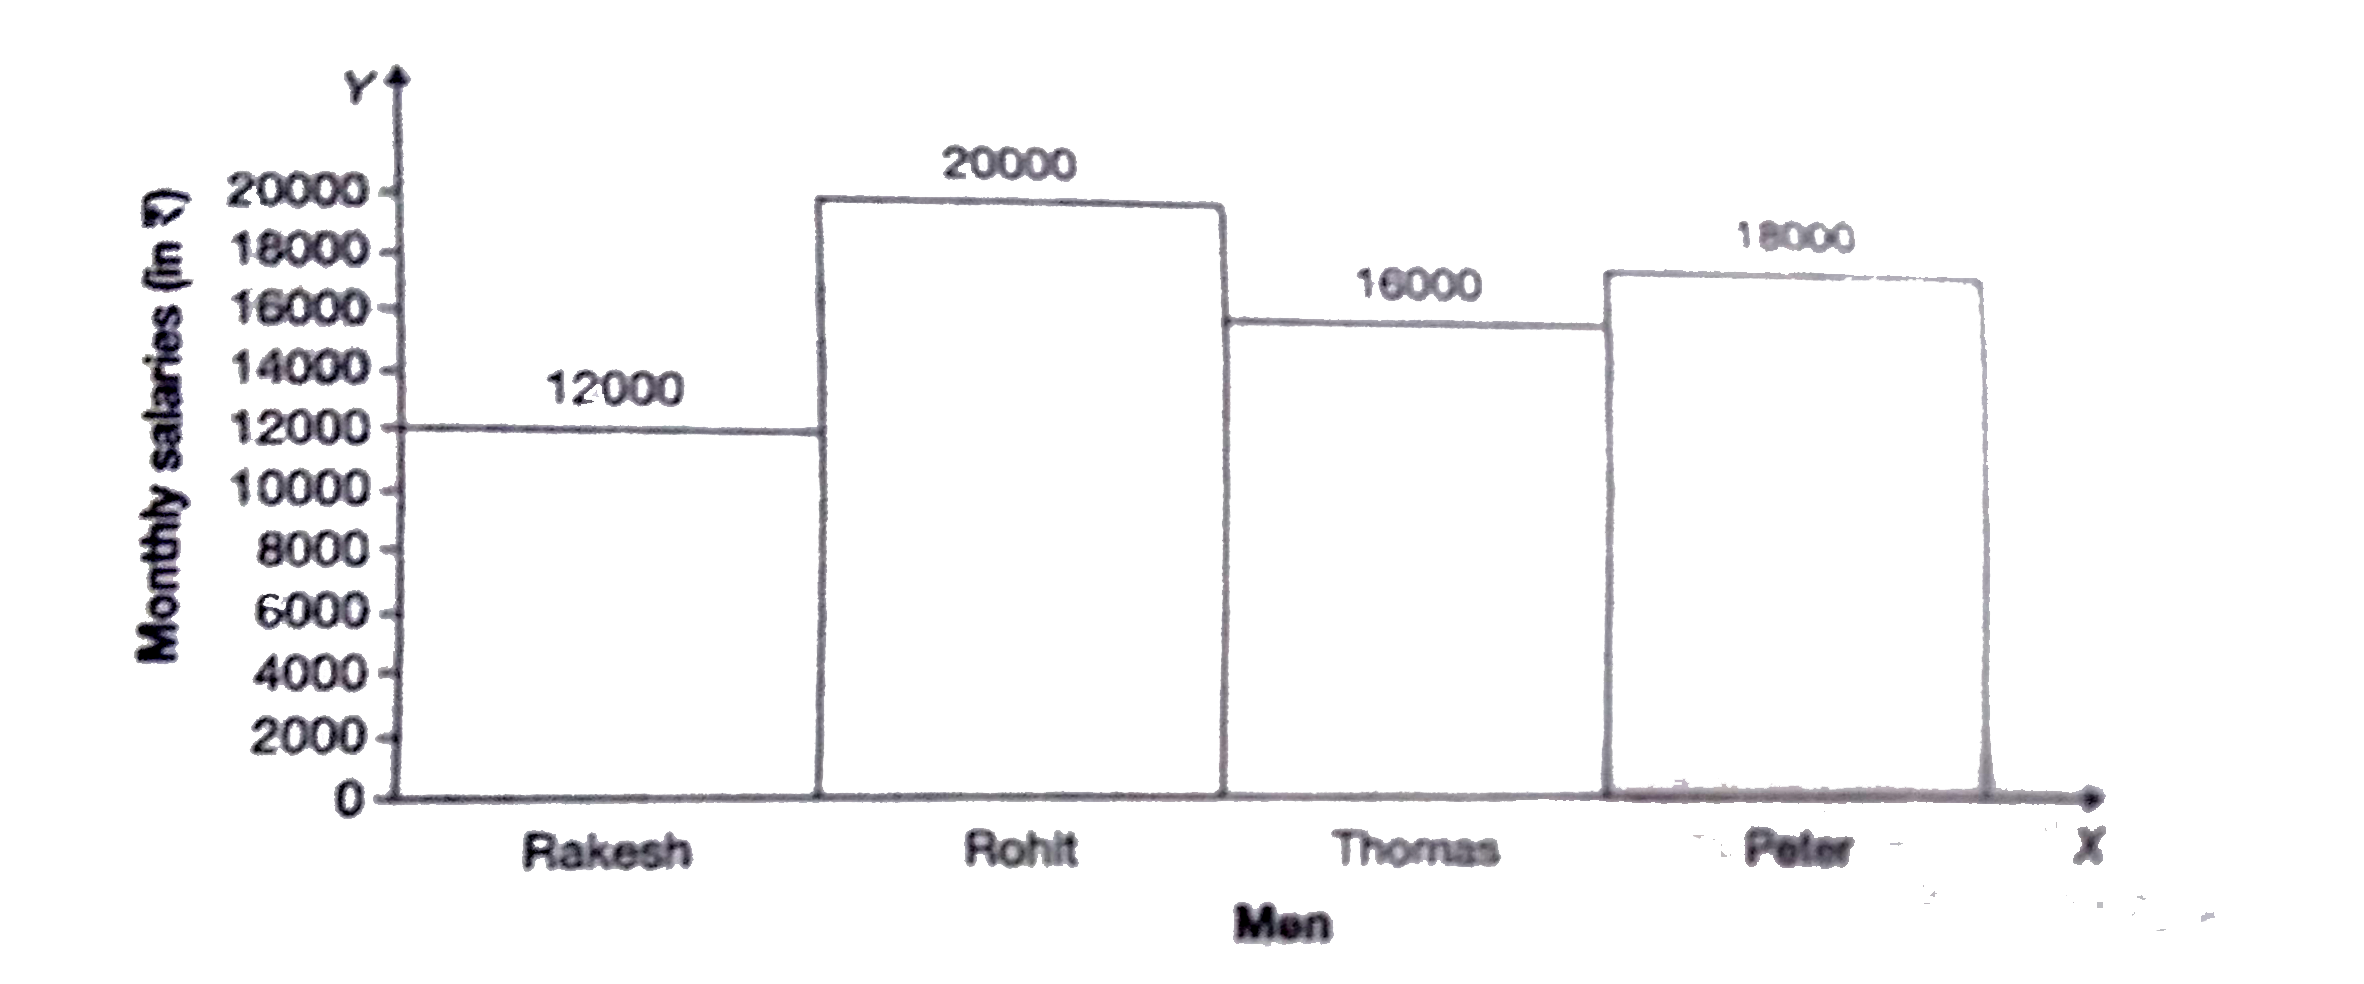
The histogram given below shows the monthly salaries of four men. Study the graph carefully and answer the question that follow.

(i) What is the difference between Rohit's and Peter's salaries ?
(ii) If Rakesh spends Rs. 10000 of his salary and saves the rest, how much will save in a year ?
(iii) If Thomas's salary is increased by Rs. 2000, then persons' salary will be equal to that of Thomas ? View SolutionQuestion 5
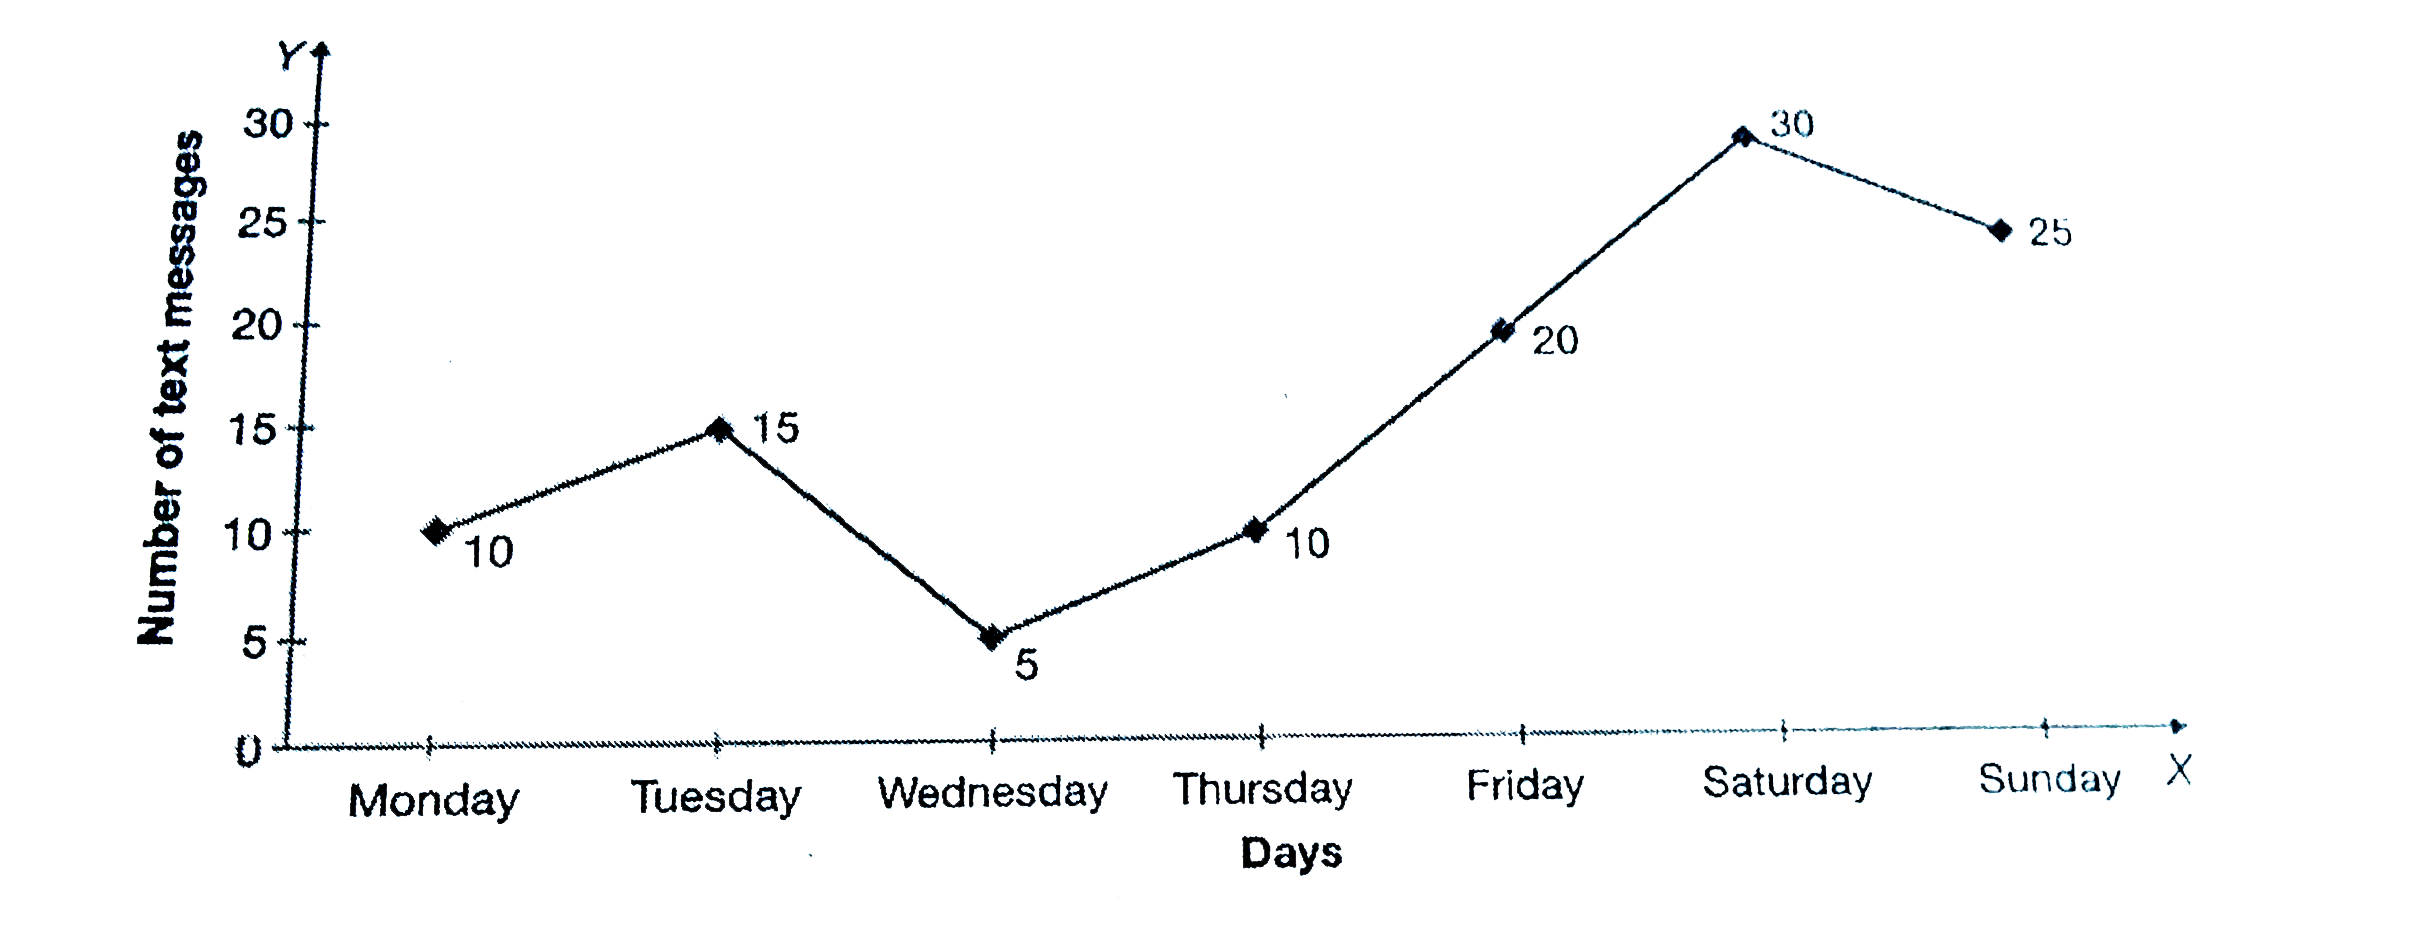
The line graph given below shows the number of text messages received by Keerthi during a week. Study The graph carefully and answer the questions that follow.

(i) On which day did Keerthi receive exactly 20 text message ?
(iii) Find the total number of text messages received by Keerthi in week. View Solution
