Study the following graph and answer the question that follow. From which institute is the difference between the appeared candidates and passed candidates maximum?
1 B
2 G
3 D
4 F
Answer : 4. "F"
Related Solutions
Study the following graph and answer the questions that follows:-
Number of appeared candidates and passed Candidates (in hundreds) in a test from six different institutions.
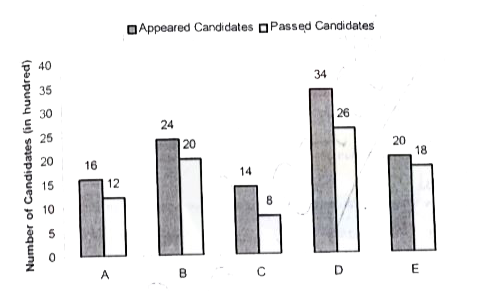
From which institution the difference between the appeared candidates and passed candidates is maximum?
View SolutionStudy the following graph and answer the questions that follows:-
Number of appeared candidates and passed Candidates (in hundreds) in a test from six different institutions.
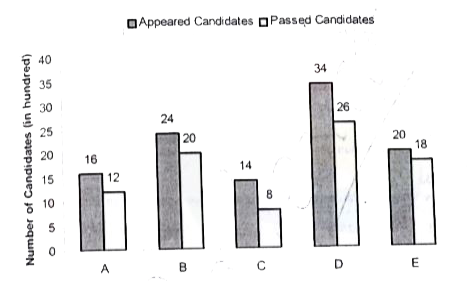
What is the average number of candidates passed from all the institutions together?
View SolutionStudy the following graph and answer the questions that follows:-
Number of appeared candidates and passed Candidates (in hundreds) in a test from six different institutions.
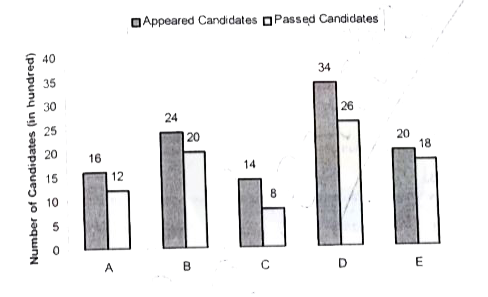
What is the respective ratio between the number of candidates who have failed from institution B and the number of candidates who have appeared from institutions E ?
View SolutionStudy the following graph and answer the questions that follows:-
Number of appeared candidates and passed Candidates (in hundreds) in a test from six different institutions.
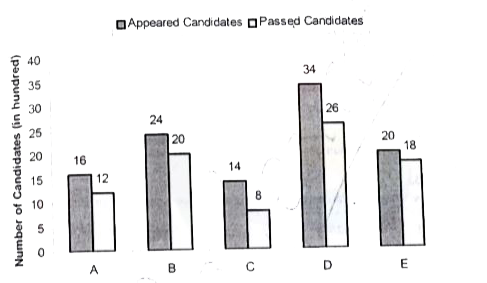
Number of candidates passed from institutions C and D together is approximately what percentage of the total number of candidates appeared from institutions B and E together?
View SolutionStudy the following pie chart carefully gives the answer-
Classification of appeared candidates in a competitive test from different institutes and qualified candidates.
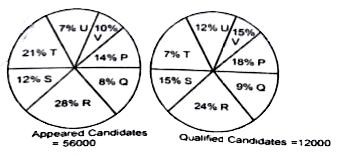
What is the difference between the number of qualified candidates of institute R and those of T ?
View SolutionStudy the following pie chart carefully gives the answer-
Classification of appeared candidates in a competitive test from different institutes and qualified candidates.
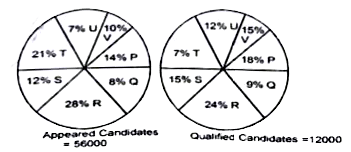
What is the average number of appeared candidates from institutes P, T and V together ?
View SolutionStudy the following pie chart carefully gives the answer-
Classification of appeared candidates in a competitive test from different institutes and qualified candidates.
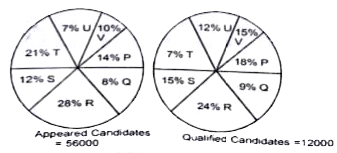
What is the ratio between the number of candidates two qualified from institutes P and R together to the no. of candidates who appeared from institutes Q and V together ?
View SolutionStudy the following graph and answer the questions that follows:-
Number of appeared candidates and passed Candidates (in hundreds) in a test from five different institutions.
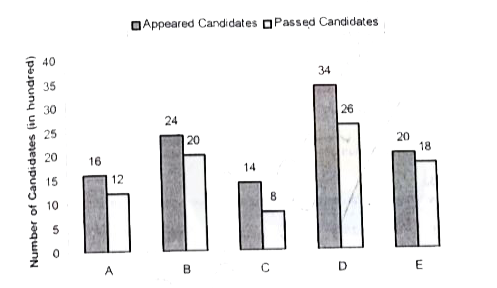
What is the ratio between the number of candidates appeared from institutions A, C and E together and candidates passed from B, D and E together? a)25:8 b)6:11 c)4:7 d)25:32
View SolutionStudy the following graph carefully and answer the question given below
Number of candidates appeared (in thousand) and percentage of candidates qualified in a competitive examination over the years.
No. of candidates appeared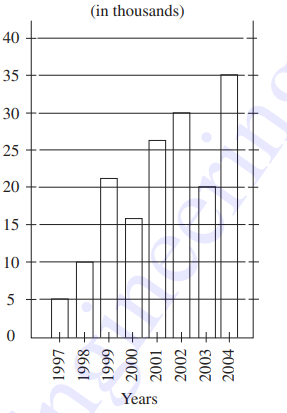
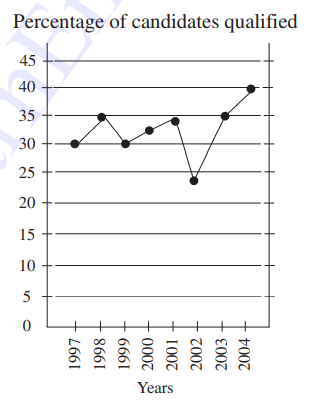
How many candidates qualified in the year 2002?
View SolutionStudy the following pie chart carefully gives the answer-
Classification of appeared candidates in a competitive test from different institutes and qualified candidates.
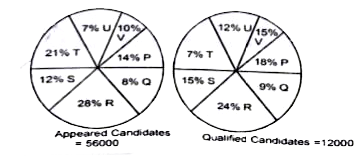
What is the percentage of qualified candidates with respect to appeared candidates from institutes P and R taken together ? (Rounded to two decimal places) ?
View SolutionStudy the following graph carefully and answer the question given below
Number of candidates appeared (in thousand) and percentage of candidates qualified in a competitive examination over the years.
No. of candidates appeared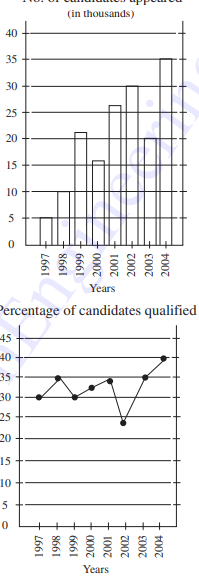
What was the ratio between the number of candidates appeared in 1997 and the number of candidates qualified in 2004?
View SolutionStudy the following table and answer questions:
Number of candidates appeared in an examination from five cities:
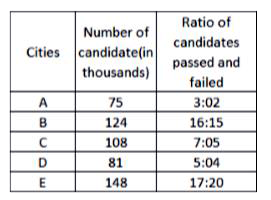
The number of candidates appearing for the examination from city D is what percent of the total number of candidates failed in cities A and B?
View SolutionStudy the following graph carefully and answer the question given below
Number of candidates appeared (in thousand) and percentage of candidates qualified in a competitive examination over the years.
No. of candidates appeared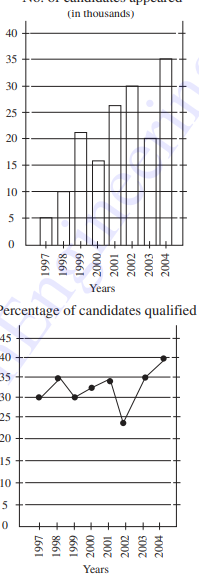
The number of candidates qualified in 1999 was what percentage of the number of candidates appeared in 1998?
View SolutionStudy the following pie chart carefully gives the answer-
Classification of appeared candidates in a competitive test from different institutes and qualified candidates.
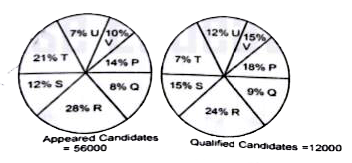
What is the sum total number of appeared students from institute R and total number of qualified students from institute P and S together ?
View SolutionStudy the following graph carefully and answer the question given below
Number of candidates appeared (in thousand) and percentage of candidates qualified in a competitive examination over the years.
No. of candidates appeared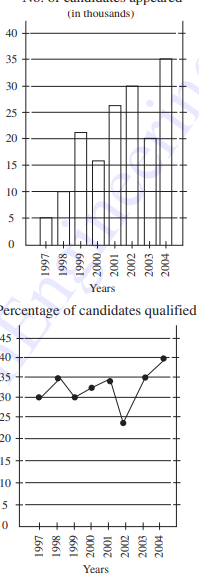
What was the percentage drop in thee number of candidates appeared from the year 2002 to 2003?
View Solutionनिम्नलिखित तालिका का अध्ययन करें और दिए गए सवाल का जवाब दें
ये तालिका उन उम्मीदवारों की संख्या को दर्शाती है, जिन्होंने अलग-अलग वर्षों में अलग-अलग राज्यों से सरकारी परीक्षा उत्तीर्ण की थी।
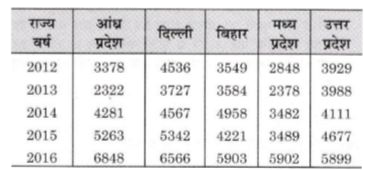
2012 में दिल्ली से परीक्षा उत्तीर्ण करने वाले उम्मीदवारों की संख्या और 2015 में मध्य प्रदेश से परीक्षा उत्तीर्ण करने वाले उम्मीदवारों की संख्या के बीच अन्तर कितना है?
View SolutionStudy the following graph carefully and answer the question given below
Number of candidates appeared (in thousand) and percentage of candidates qualified in a competitive examination over the years.
No. of candidates appeared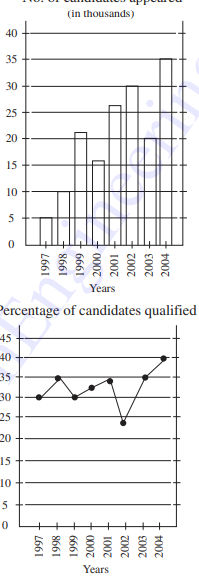
In which of the following years was the number of candidates qualified the lowest among the given years?
View SolutionStudy the following table and answer questions:
Number of candidates appeared in an examination from five cities:
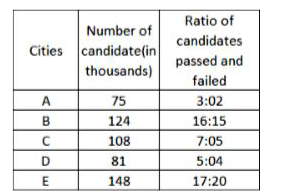
The number of cities, in which pass percentage of candidates is more than 55%, is:
View SolutionThese questions are based on the following graphs :
Details of statewise distribution of candidates appeard in an examination.
Total appeared candidates = 1,00,000
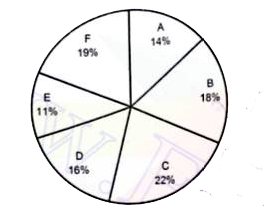
Ratio of Male and female candidates appeared
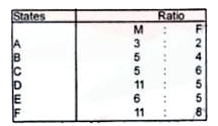
The number of female candidates appeared from state C is double to the number of male candidates appeared in the examination from which state ?
View SolutionStudy the following table and answer questions:
Number of candidates appeared in an examination from five cities:
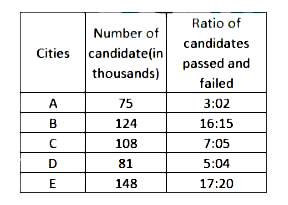
The ratio of the total number of candidates who passed from cities A and C to that who failed in cities B and E is:
View Solution