Study the given bar graph and pie chart to answer the following questions. The bar graph shows the production in thousand tonnes of Wheat Rice and Maize in dif
null
null
null
null
Answer : Explanation :1. Answer : 2 Explanation : Productivity = Total production/area of Agr.lan
Related Solutions
In the given pie-chart, the comaprative study of the production or Rice, Wheat, Sugar and Tea of a country is given. Study the pie-chart and answer the following questions.
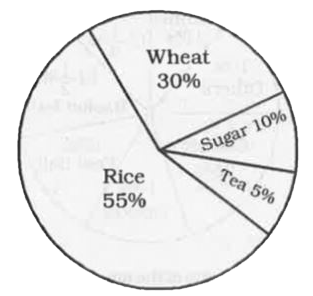
The production of rice and tea is more / greater than production of wheat by
View Solutionदिए गए पाई -चार्ट में देश में चावल, गेहूँ , चीनी और चाय के उत्पादन का तुलनात्मक अध्ययन किया गया है । निम्नलिखित प्रशनो के उत्तर ग्राफ को पढ़कर दीजिये|
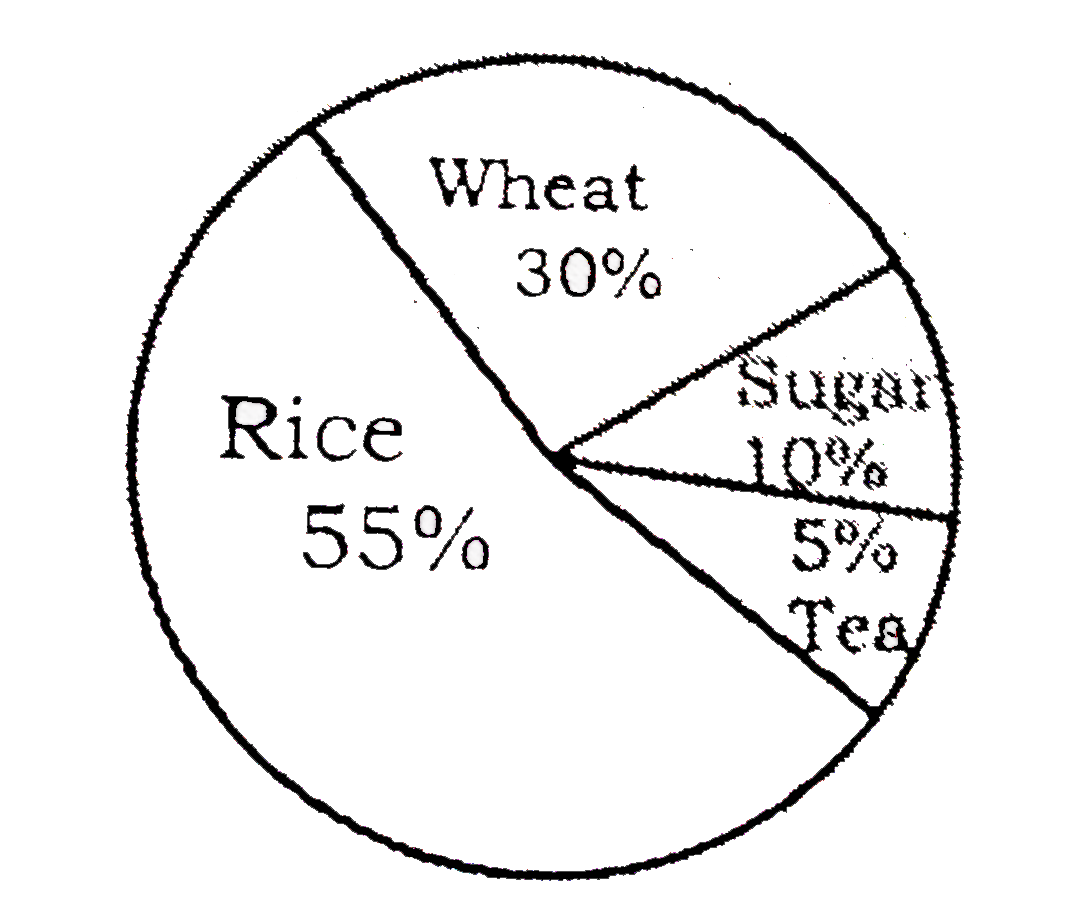
चावल और चाय का उत्पादन गेहूँ के उत्पादन से कितना ज्यादा है ?
View SolutionStudy the given bar chart carefully and answer the questions based on it.
Bar chart represents the production (in lakh tonne) of wheat from 2005 to 2010.
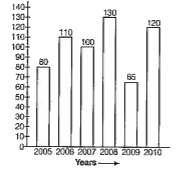
For which of the following year, wheat production is maximum?
View SolutionStudy the given bar chart carefully and answer the questions based on it.
Bar chart represents the production (in lakh tonne) of wheat from 2005 to 2010.
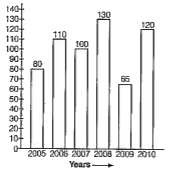
For which of the following year, wheat production is minimum?
View SolutionStudy the given bar graph carefully and answer the questions based on it. Production (in lakh tonne) of wheat from 2005-10 What is the mean production for all the years?
View SolutionRead the following bar graph and answer the following questions Which state has the total production of wheat and rice as its maximum?
View SolutionRead the following bar graph and answer the following questions Which state has the total production of wheat and rice minimum?
View SolutionRead the following bar graph and answer the following questions: What information is given by the bar graph? Which state is the largest producer of rice? Which state is the largest producer of wheat? Which state has total production of rice and wheat as its maximum? Which state has the total production of wheat and rice minimum?
View SolutionRead the following bar graph and answer the following questions: What information is given by the bar graph? Which state is the largest producer of rice? Which state is the largest producer of wheat? Which state has total production of rice and wheat as its maximum? Which state has the total production of wheat and rice minimum?
View SolutionIn the given pie-chart, the comaprative study of the production or Rice, Wheat, Sugar and Tea of a country is given. Study the pie-chart and answer the following questions.
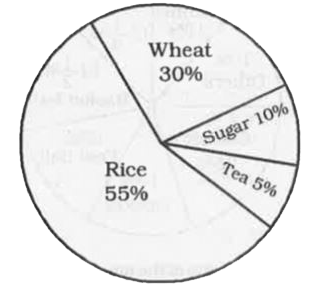
The central angle of percentage of wheat is
View SolutionStudy the given bar chart carefully and answer the questions based on it. Bar chart represents the production (in lakh tonne) of wheat from 2005 to 2010. What is the mean production for all the years?
View SolutionStudy the given bar graph carefully and answer the questions based on it.
Production (in lakh tonne) of wheat from 2005-10
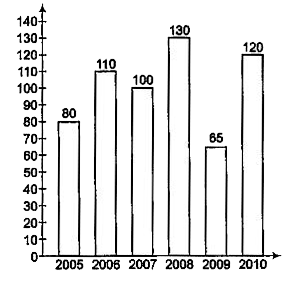
For which of the following year, wheat production is maximum?
View SolutionStudy the given bar graph carefully and answer the questions based on it.
Production (in lakh tonne) of wheat from 2005-10
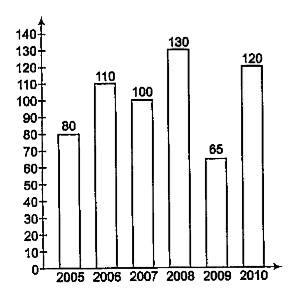
For which of the following year, wheat production is minimum?
View SolutionThe pie-chart given in Figure shows the annual agricultural production of an Indian state. If the total production of all the commodities is 81000 tonnes, find the production (in tonnes) of Wheat (ii) Sugar (iii) Rice (iv) Maize (v) Gram
View SolutionStudy the following bar graph carefully. Answer the following questions. What information can be obtained from the given bar graph?
View SolutionStudy the following bar graph and answer the question that follows.
View Solutionनिम्नलिखित दण्डालेख, भारत में विभिन्न वर्षो में चाय का उत्पादन (हजार टन में ) दिखाता है। इसके अनुसार रिक्त को भरे।
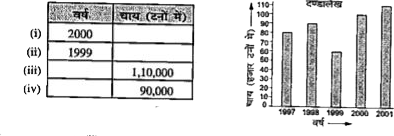
View SolutionRead the bar graph given in Figure and answer the following questions: What information is given by the bar graph? What was the crop-production of rice in 1970-71? What is the difference between the maximum and minimum production of rice?
View SolutionThe given bar graph shows the biscuit exports of India over a period of five years. Study the graph and answer the questions that follows
View SolutionThe pie chart shows the value of the total annual agricultural production of a country. Study the diagram and answer the following questions.
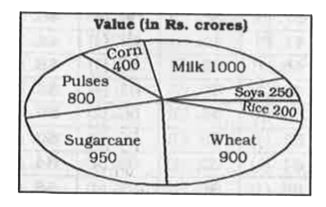
If the value of wheat is Rs. 15,000 per tonne, how many tonnes of wheat was produced?
View Solution