The question below is based on the given diagram. The diagram shows three figures each representing scientists Government employees and employees of Company X. Which of the following represents
1 Only C
2 C and G
3 G, C and F
4 C and F
Answer : 5. "Only F"
Related Solutions
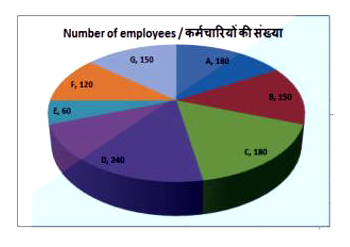
The HR department of a company prepared a report. The pie chart represents all the employees of the company and to which state they belong to. Study the diagram and answer the following questions.
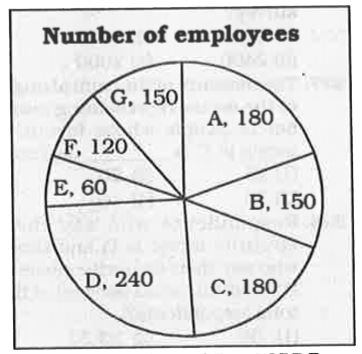
What is the total number of employees of the company?
View SolutionThe HR department of a company prepared a report. The pie chart represents all the employees of the company and to which state they belong to. Study the diagram and answer the following questions.

What is the total number of employees of the company?
View SolutionThe HR department of a company prepared a report. The pie chart represents all the employees of the company and to which state they belong to. Study the diagram and answer the following questions.
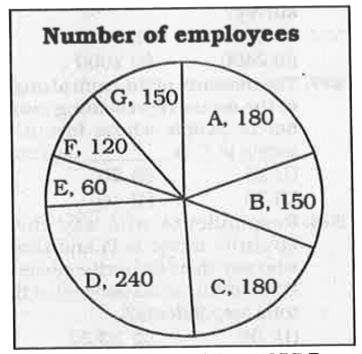
The least number of employees are from which state?
View SolutionThe HR department of a company prepared a report. The pie chart represents all the employees of the company and to which state they belong to. Study the diagram and answer the following questions.

The least number of employees are from which state?
View SolutionThe bar graph shows the number of employees working in the different departments of a company. Study the diagram and answer the following questions Which department has the lowest number of employees?
View SolutionThe HR department of a company prepared a report. The pie chart represents all the employees of the company and to which state they belong to. Study the diagram and answer the following questions.
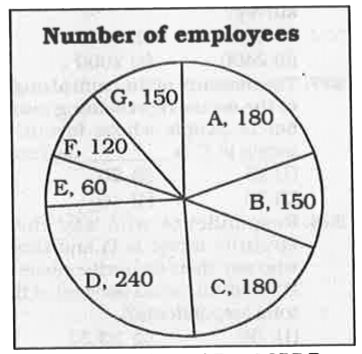
If the average monthly salary of the employees of this company is Rs. 25,000 then what is the total of the salaries (in Rs. lakhs) paid to all the employees of this company?
View SolutionThe HR department of a company prepared a report. The pie chart represents all the employees of the company and to which state they belong to. Study the diagram and answer the following questions.

If the average monthly salary of the employees of this company is Rs. 25,000 then what is the total of the salaries (in Rs. lakhs) paid to all the employees of this company?
View SolutionThe HR department of a company prepared a report. The pie chart represents all the employees of the company and to which state they belong to. Study the diagram and answer the following questions.
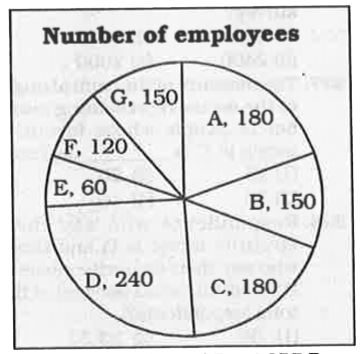
The measure of the central angle of the sector representing state B is ____ degrees.
View SolutionThe HR department of a company prepared a report. The pie chart represents all the employees of the company and to which state they belong to. Study the diagram and answer the following questions.The measure of the entral angle of the sector representing state E is _______ degrees.
View SolutionIn each of the following questions, identify the diagram that best represents the relationship among classes given below:
Professors, Researchers, Scientists

View Solutionवह आरेख चुनिए जो नीचे दिए गए वर्गों के बीच के संबंध का सही निरूपण करता है|
कर्मचारी वर्ग, प्रबंधक, कर्मचारी
View SolutionQuestions based on diagram : Label the given diagrams. : The diagram given below represents a tuning fork. :
View SolutionThe HR department of a company prepared a report. The pie chart from the report shows number of employees in all the departments that thew company has. Study the diagram and answer the following questions.
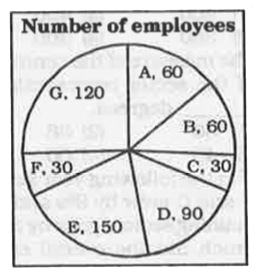
The most number of employees belong to which department?
View SolutionThe HR department of a company prepared a report. The pie chart from the report shows number of employees in all the departments that thew company has. Study the diagram and answer the following questions.
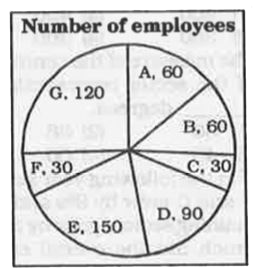
What is the total number of employees of the company?
View SolutionThe line graph shows the Sales per employee of a certain company. Study the diagram and answer the following questions.
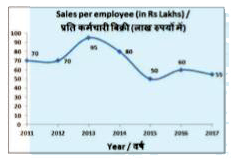
If the number of employees of the company was 80 in the year 2015 then what was the sales (in Rs crore) of the company in the year 2015?
View SolutionThe data of a company’s employees is shown by the given Venn diagram. The circle represents ‘engineers’, the triangle represents computer experts’, the rectangle represents ‘MBAs’ and the pentagon represents ‘females’. The numbers given in the diagram represent the number of persons of that particular category.
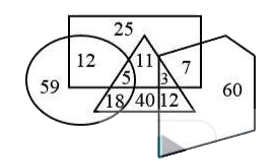
How many of the employees are MBAs, and how many male MBAs are comuter experts but NOT engineers, respectively ?
View SolutionQuestions based on diagram :
Label the given diagrams. :
The diagram shown below represents the internal construction of a loudspeaker. :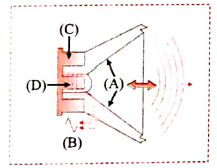
View Solutionदिया गया पाई आरेख किसी कम्पनी के अलग-अलग विभागों में कुल 800 कर्मचारियों के प्रतिशत वितरण को दर्शाता है।
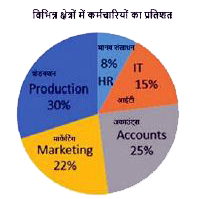
मार्केटिंग के क्षेत्र में कितने कर्मचारी कार्यरत हैं ?
View SolutionQuestion based on diagram :
Observe the given figure and answer the questions below it :
What does the arrows represent ? :

View SolutionChoose the Venn diagram from the given options that best represents the relationship amongst the following classes: Clerk, Male, Permanent Employee
View Solution