What was the trade deficit of India in the year 2018-2019?
1 $156 Billion
2 $176 Billion
3 $106 Billion
4 $196 Billion
Answer : 2. "$176 Billion"
Related Solutions
What is the target (in terms of GDP) of fiscal deficit for financial year 2019-20?
View SolutionWhat is meant by trade deficit?
View SolutionRead the following graph and answer questions The ratio of the number of years, in which the trade deficit is above the average deficit, to those years in which the trade deficit is below the average deficit, is
View SolutionAt the time of independence, India's trade balance was deficit.
View SolutionWhich company was ranked as the largest profit making PSU in India for the fiscal year 2018-2019?
View SolutionWhich company was ranked as the largest profit making PSU in India for the fiscal year 2018-2019?
View SolutionUsing budget estimates of government of India for the year 2008-09 calculate : Revenue deficit , Fiscal deficit , Primary deficit :
View SolutionThe average of sales of a furniture shop in the years 2015, 2016, 2017, 2018 is Rs 16300, and that for years 2016, 2017, 2018, 2019 is Rs 18450. If the sales in 2019 are Rs 9200, then what are the sales in 2015?
View SolutionThe remainder when is divided by 5 is
View SolutionWhen will balance of trade show a deficit?
View SolutionWhen will balance of trade show a deficit?
View SolutionDeficit in balance of trade indicates deficit in balance of payments also.
View SolutionThe Hindu Sahitya Samman 2018 was presented in the year 2019 for lifetime achievements of the Hindu Sahitya Samman 2018.
View SolutionPrevious Year Paper 2018-All India
View SolutionPrevious Year Paper 2018-All India
View SolutionThe first Trade Union was founded in India in the year 1918 by
View SolutionThe given bar graph shows the sales of cars from six branches of a dealer B1 , B2 , B3, B4 ,B5,B6, during two consecutive years and 2018 and 2019 .Blue colour corresponds to the year 2018 and red colour corresponds to the year 2019 . The average sale of cars (from all branches ) for the year 2018 is :
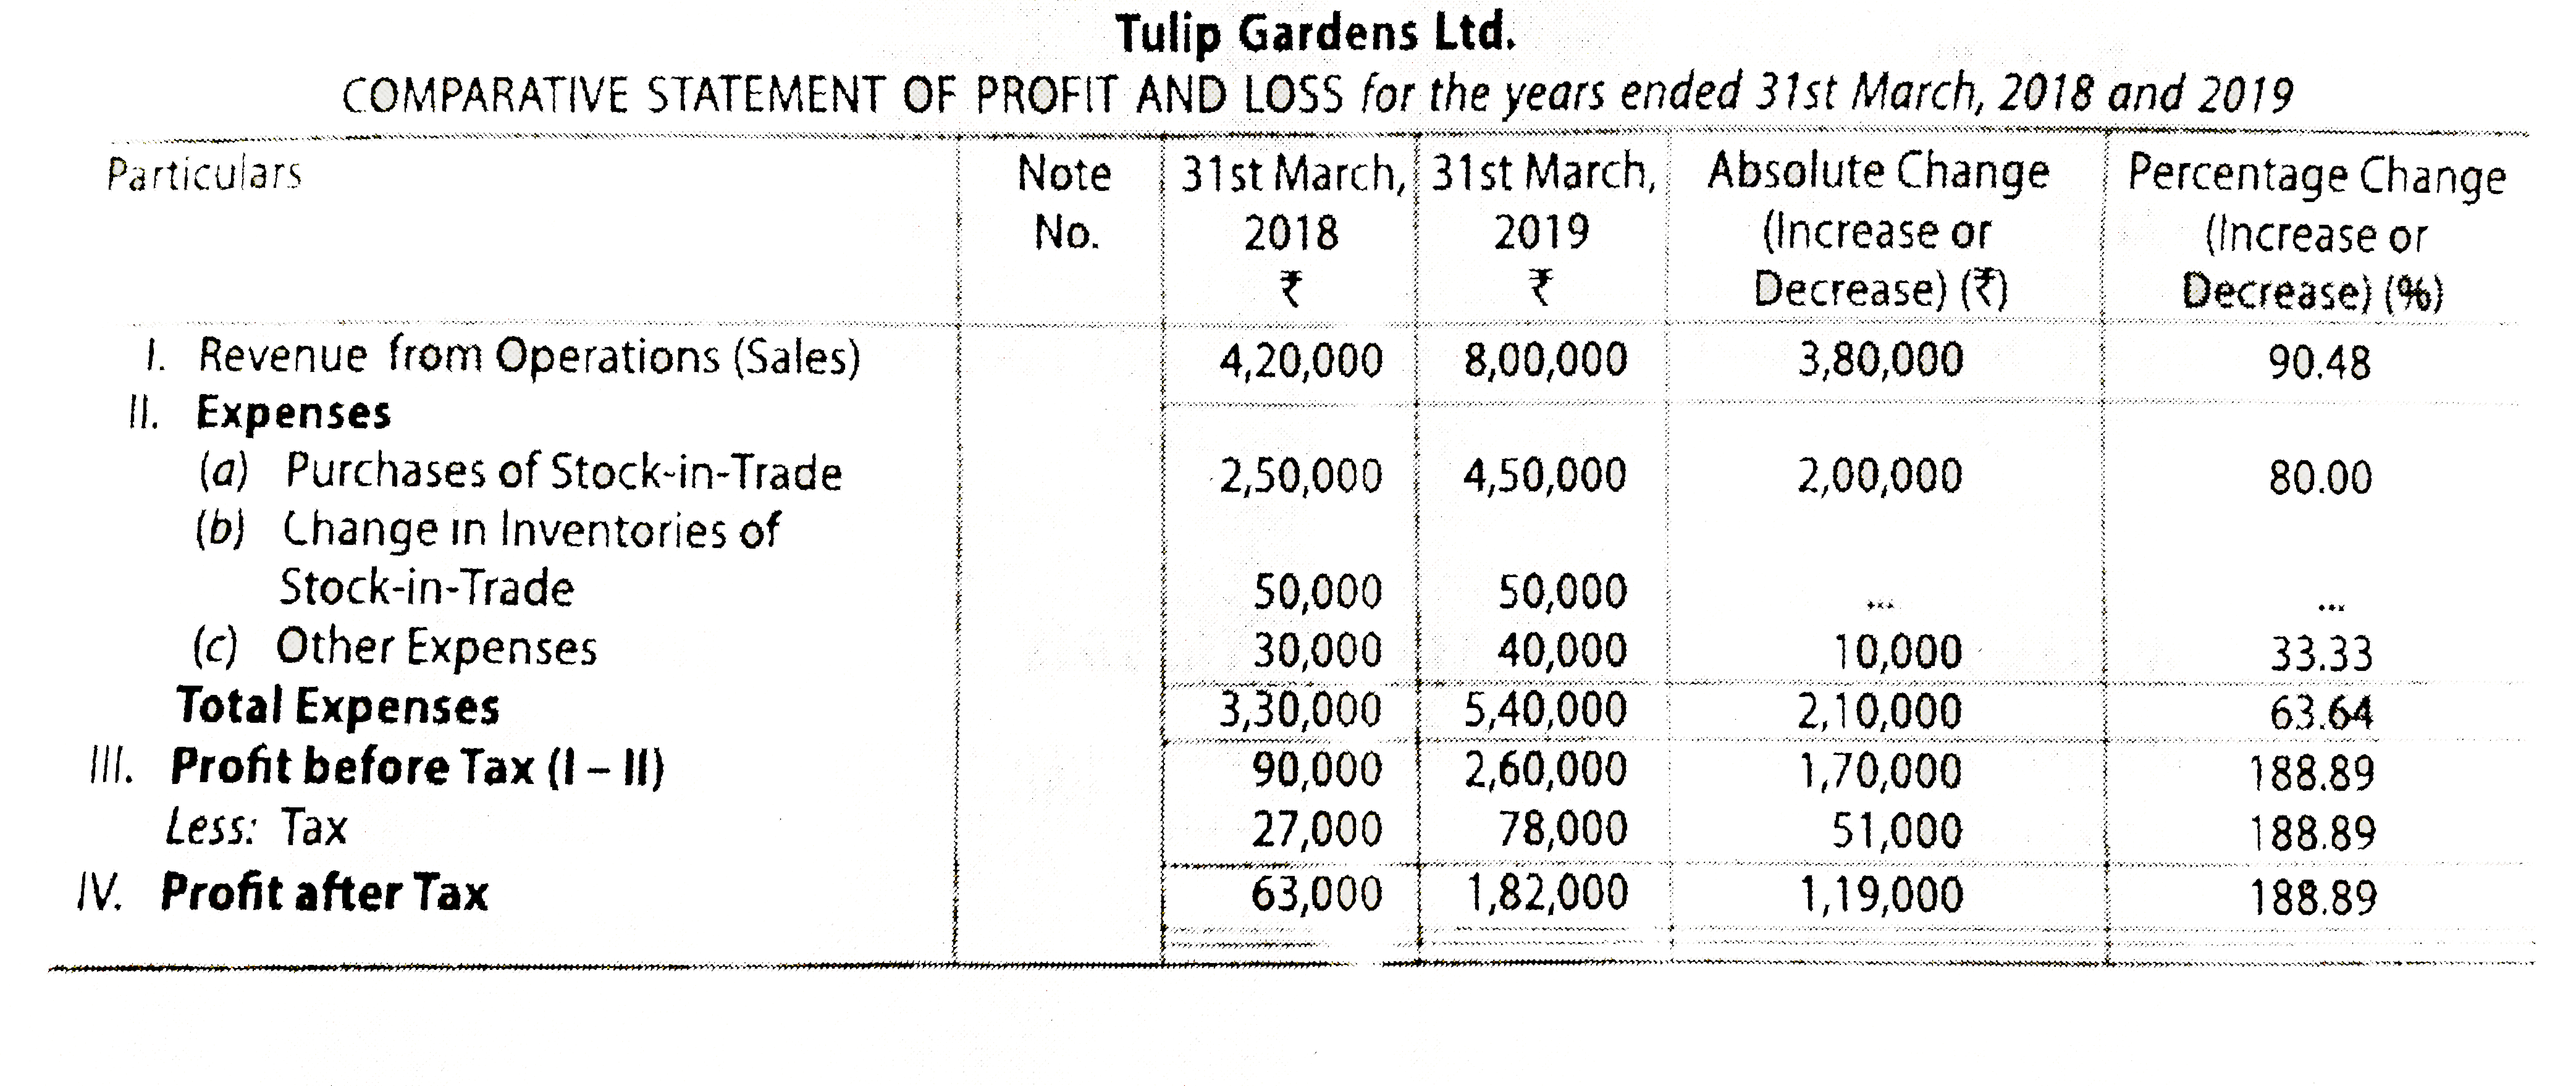
View SolutionComparative statement of profit and loss for the years ended 31st march 2018 and 2019

From the above comparative statement of profit and loss for the year ended 31st march 2018 and 31st march 2019 compute gorss profit ratio.
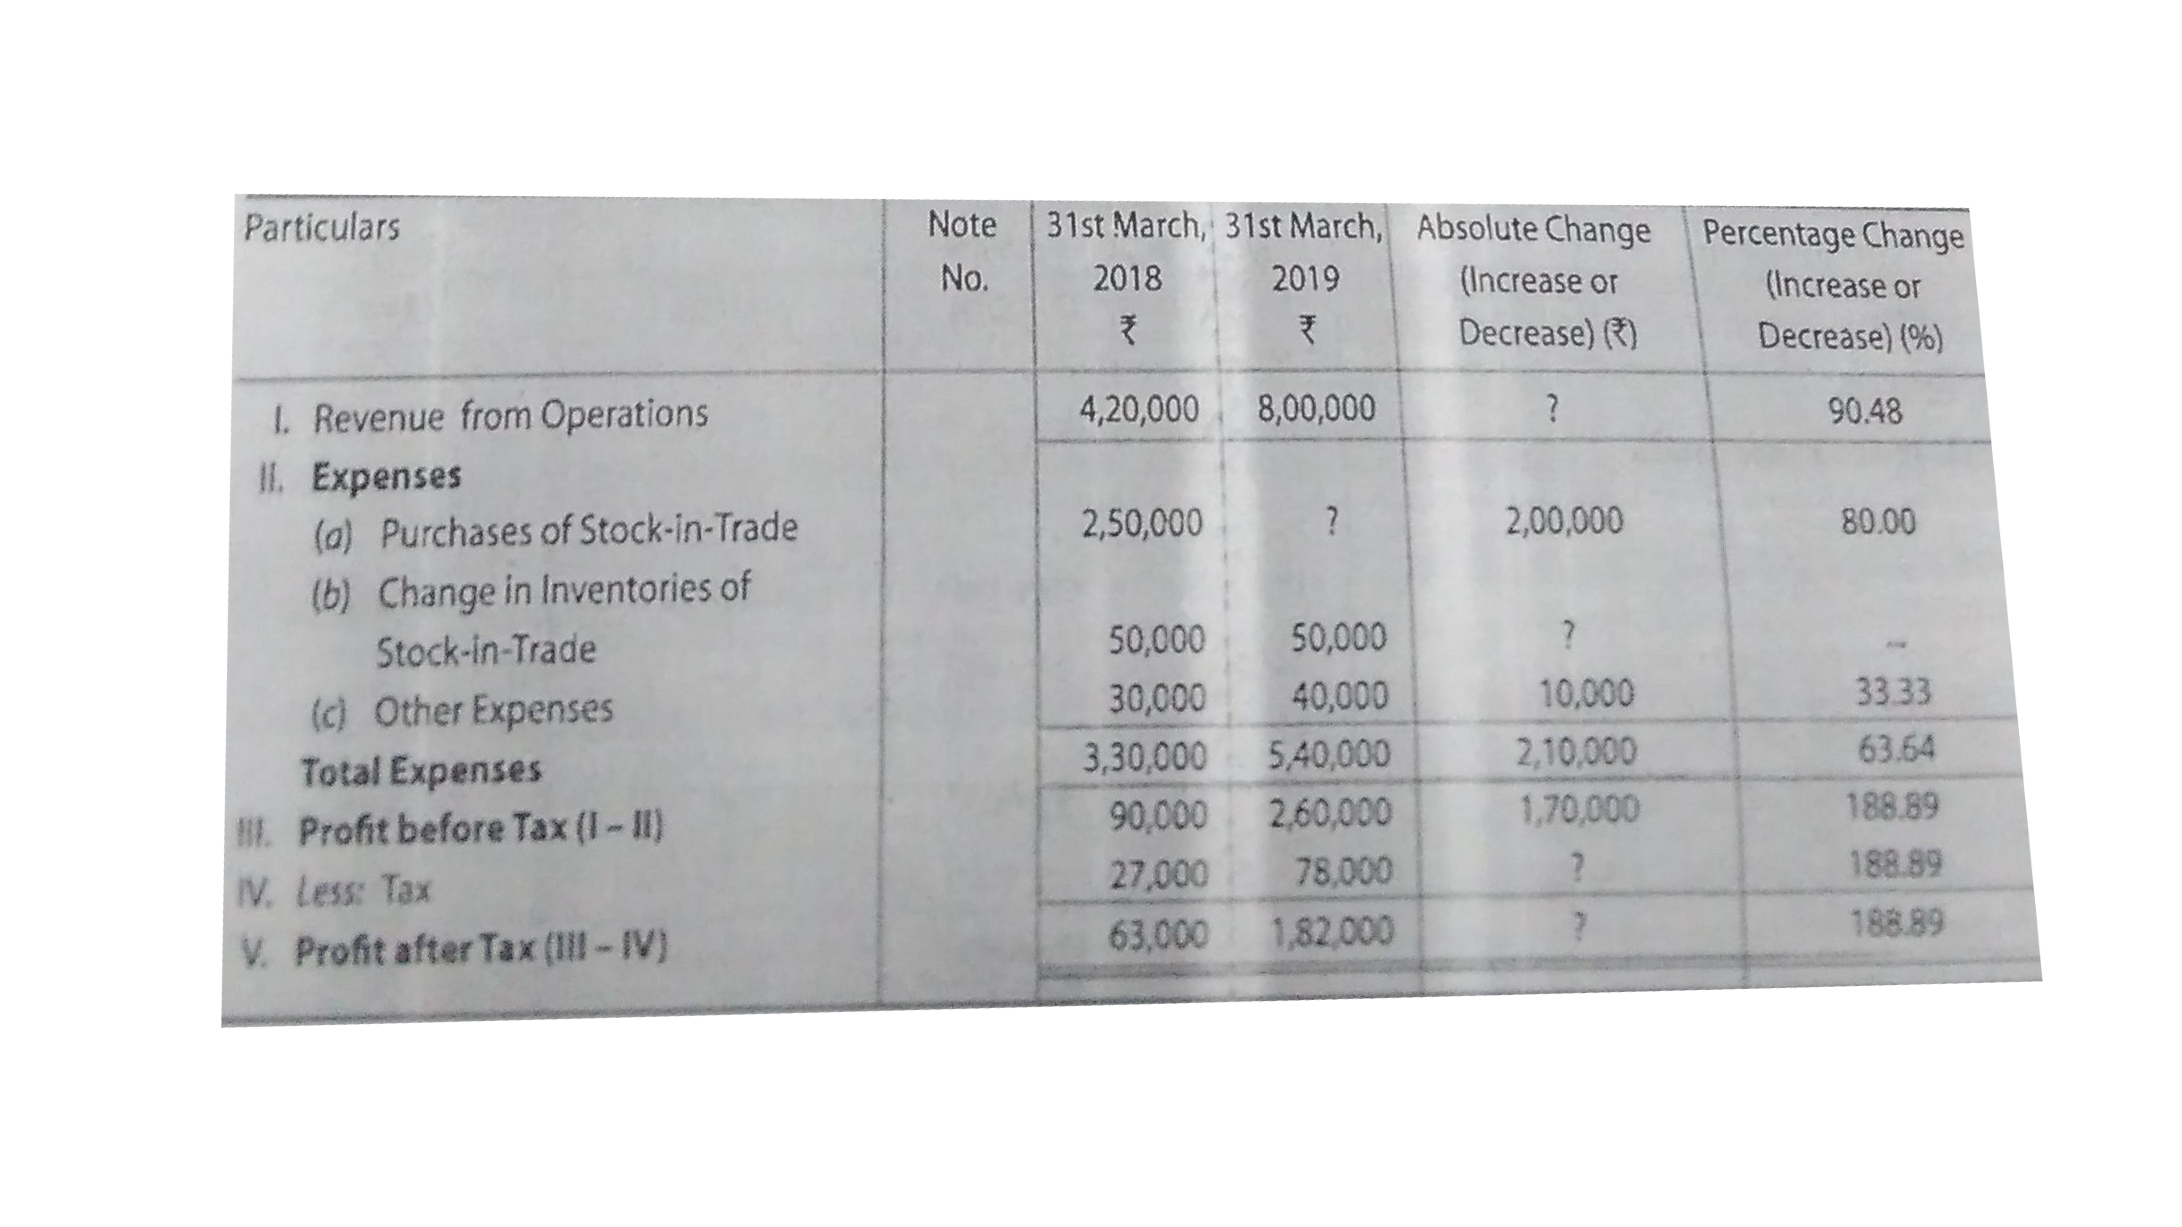
View SolutionF.Icon Ltd.
COMPARATIVE STATEMENT OF PROFIT AND LOSS for the years ended 31st March, 2018 and 2019

Complete the above Comparative Statement of Profit and Loss for the year ended 31st March 2018 and 2019.
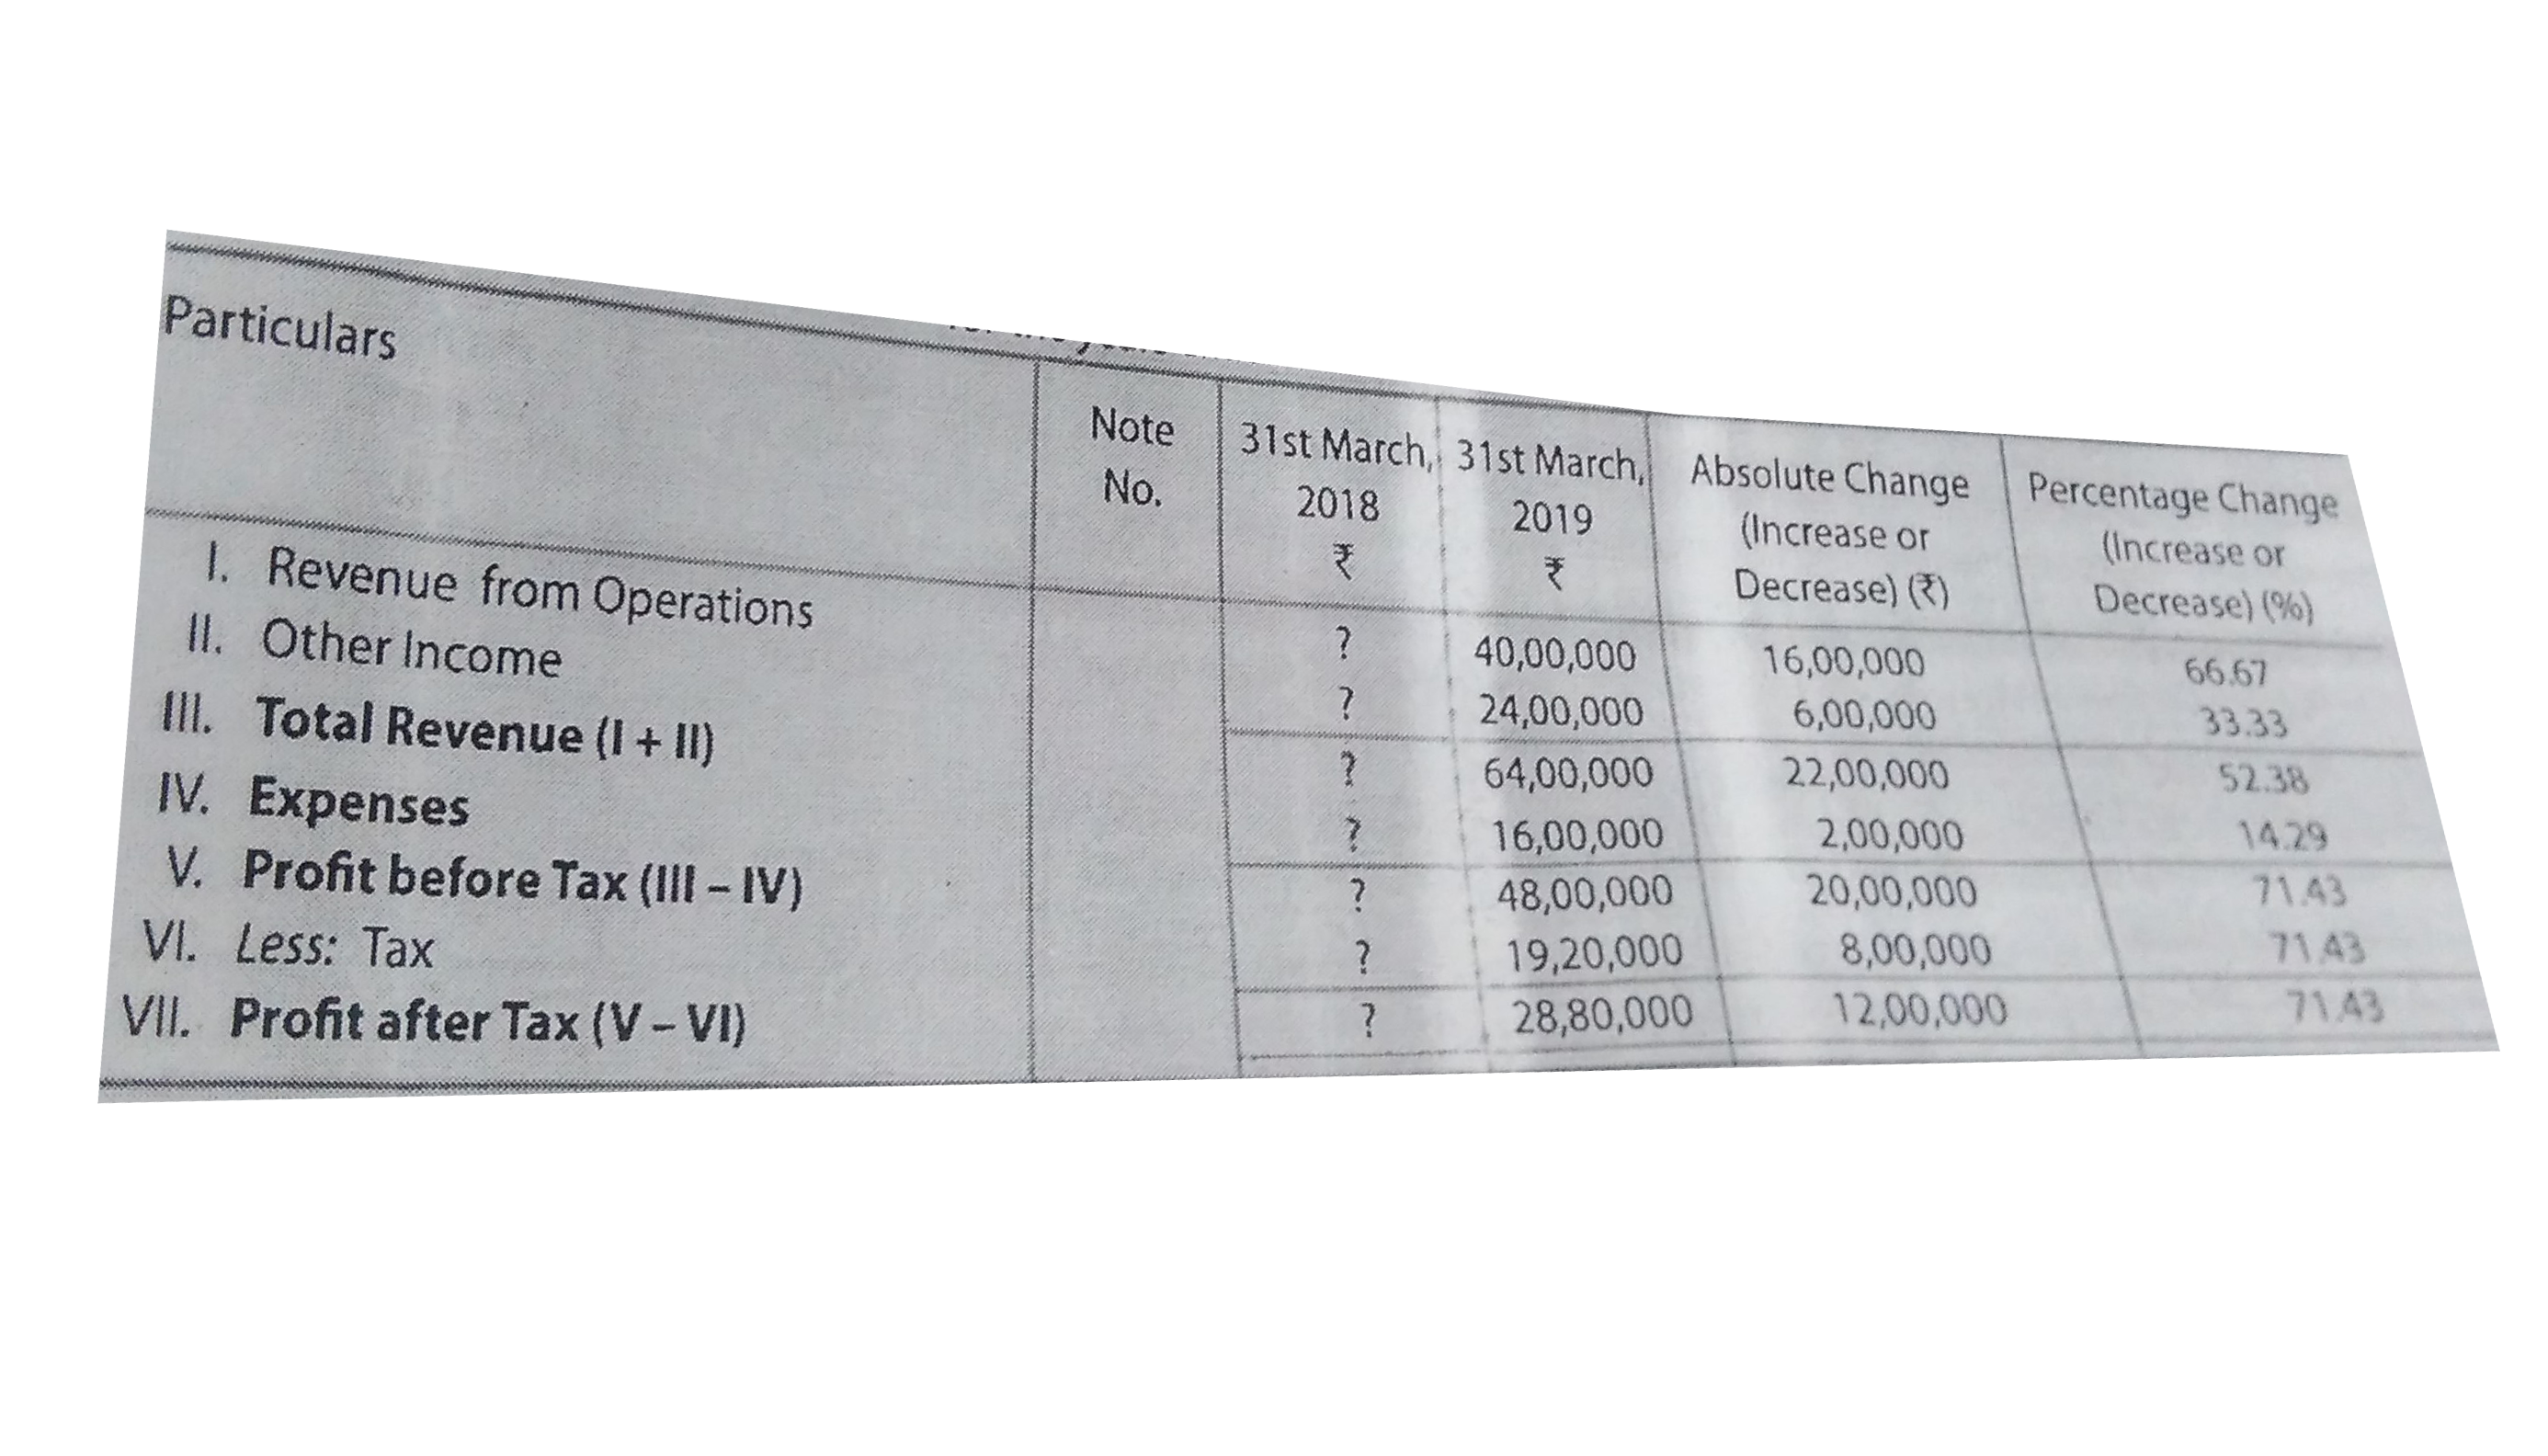
View SolutionB4L Ltd.
COMPARATIVE STATEMENT OF PROFIT AND LOSS
for the years ended 31st March, 2018 and 2019

Complete the above Comparative Statement of Profit and Loss for the years ended 31st March, 2018 and 2019.
View Solution