Read the following graph and answer questions
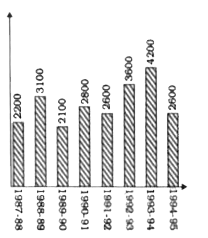
The ratio of the number of years, in which the trade deficit is above the average deficit, to those years in which the trade deficit is below the average deficit, is
3:5
5:3
4:4
3:4
The correct Answer is:A
Step by step video & image solution for Read the following graph and answer questions The ratio of the number of years, in which the trade deficit is above the average deficit, to those years in which the trade deficit is below the average deficit, is by Maths experts to help you in doubts & scoring excellent marks in Class 14 exams.
Updated on:21/07/2023Topper's Solved these Questions
- STATISTICS AND DATA INTERPRETATIONBOOK - KIRAN PUBLICATIONCHAPTER - STATISTICS AND DATA INTERPRETATIONEXERCISE - TYPE-III
39 Videos
- STATISTICS AND DATA INTERPRETATIONBOOK - KIRAN PUBLICATIONCHAPTER - STATISTICS AND DATA INTERPRETATIONEXERCISE - TYPE-IV
182 Videos
- STATISTICS AND DATA INTERPRETATIONBOOK - KIRAN PUBLICATIONCHAPTER - STATISTICS AND DATA INTERPRETATIONEXERCISE - TYPE-VIII
8 Videos
- SIMPLIFICATIONBOOK - KIRAN PUBLICATIONCHAPTER - SIMPLIFICATIONEXERCISE - TEST YOURSELF
25 Videos
- TIME AND DISTANCEBOOK - KIRAN PUBLICATIONCHAPTER - TIME AND DISTANCEEXERCISE - Type -XI
74 Videos
Similar Questions
Study the following bar-diagram carefully and answer the questions.
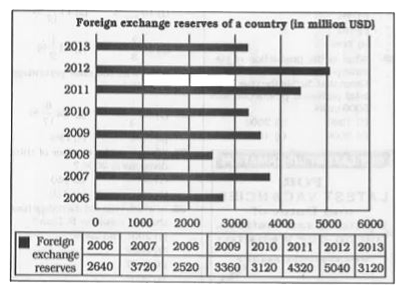
The ratio of the number of years, in which the foreign exchange reserves are above the average reserves, to those in which reserves it is less, is
View SolutionRead the following graph and answer questions
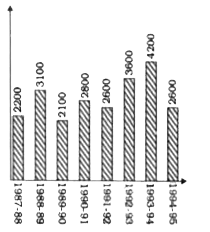
In which of the following years, the percent increase of deficit was highest over its preceding year?
View Solution
Knowledge Check
Read the graph and answer the following questions.
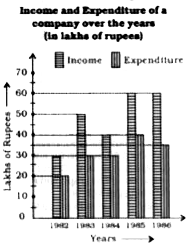
The number of years in which the income is more than the average income of the given years isAOneBTwoCThreeDFourRead the graph and answer the following questions.
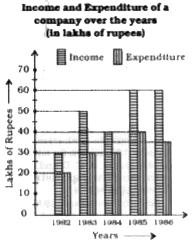
The ratio of the average income of all the years to the average profit isA24:13B48:17C12:7D6:5Study the graph carefully and answer the questions below it -----
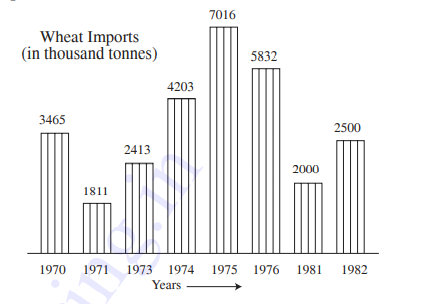
What is the ratio of the years which have above average imports to those which have below average imports ?A3 : 5B2 : 6C8 : 3D3 : 8
Read the following graph and answer questions
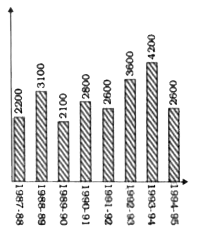
The deficit in 1993-34 was roughly how many times the deficit in 1990-91 ?
View SolutionRead the following graph and answer questions
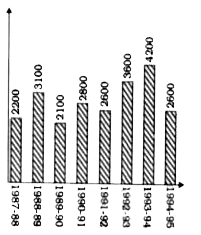
The deficit in 1992-93 was approximately how many percent of the average deficit?
View SolutionRead the following graph and answer questions
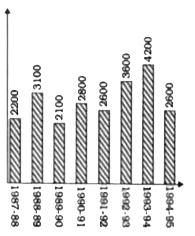
Percenatge increase in deficit in 1993-94 as comapred to deficit in 1989-90 was
View SolutionRead the following graph carefully and answer the questions given below:
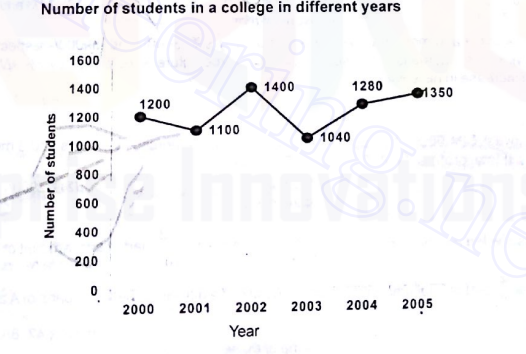
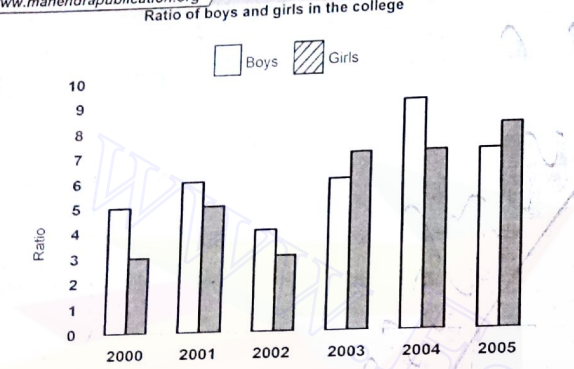
What is the average number of girls in all the years?
View SolutionRead the following graph carefully and answer the questions given below:


In which two years the number of girls is equal ?
View Solution
