Population of CBM Village year wise ........ 2000 -----> 1000 2005 -----> 400 2010 -----> 600 2012 -----> 800 what will be the appropri/ate graph for this ? a b Irruptive c ‘S’ shaped d J shaped
b Irruptive
Related Solutions
The population of five villages is as follows Village A: 800 Village B: 1200 Village C:900 Village D: 400 Village E: 600 Present a pictograph with the help of a figure showing population 100.
View SolutionIn an area, a population with large size individuals having long life span, more parental care and slow development was present. The type of population growth curve will be
(a) S - shaped
(b) J - shaped
(c) Initially J - shaped then S - shaped
(d) Initially S - shaped then J - shapedView SolutionCompare J-Shaped pattern with S-shaped pattern of population growth.
View SolutionThe bar graph given below shows the population (in crores) of 4 different states over 3 years. In the given bar graph, what is the ratio of increase in population in Bihar between 2005 and 2010 and between 2010 and 2015?
View SolutionWhat does S-shaped pattern of population growth represent? How is j-shaped pattern different from it and why?
View SolutionWhat does S-Shaped pattern of population growth represent? How is J-shaped pattern different from it and why?
View SolutionThe population of a village in Madurai is increasing year after year. Find out the population (in lakhs) in 2013 from the following information:
Year 2008 2009 2010 2011 2012 2013
Population 4 7 13 22 34 ?View SolutionThe population of a city increases at compounding rate of 8% per year. Find the population in the year 2012 if populatin in the year 2010 was 2,50,000.
View SolutionThe population of India in 1998 was 800 million. What will be the population in 2000 and 2100 if there is no change in the present growth rate which is 25 per 1000 per year?
View SolutionThe population of India in 1998 was 800 million. What will be the population in 2000 if there is no change in the present growth rate which is 25 per 1000 per year?
View SolutionWhat is meant by J-shaped chart of population?
View SolutionThe population of a village increases by 10% every year. If the present population of a village be 1000. the population after two years will be
View SolutionThe population of a village is 10,000 in the year 2012. The population increases 5% on every year then its population on 2015?
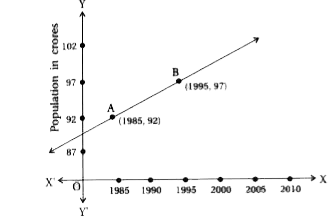
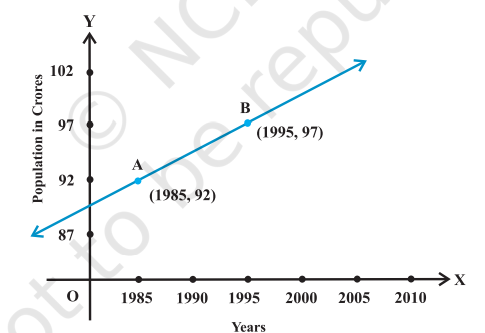
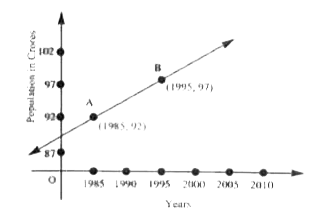
View SolutionConsider the following graph of population and year. Find the slope of the line AB and use it to tell what will be the population in the year 2010?
View SolutionConsider the following Population-Year Graph : Find the slope of the line AB and using it, find what will be the population in the year 2010 ?
View SolutionConsider the following population and year graph, find the slope of the line AB and using it, find what will be the population in the year 2010?
 View Solution
Consider the following population and year graph, find the slope of the line AB and using it, find what will be the population in the year 2010?
 View Solution
Consider the following population and year graph, find the slope of the line AB and using it, find what will be the population in the year 2010?
 View Solution
Consider the following population and year graph. Find the slope of the line AB and using it, find what will be the population in the year 2010?
View SolutionConsider the following population and year graph: find the slope of the line AB and using it find what will be the population in the year 2010.
View Solution
