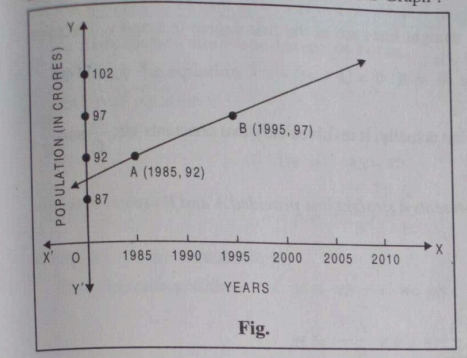
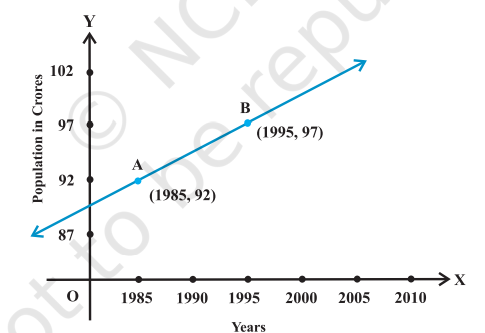
Consider the following Population-Year Graph :
 Find the slope of the line AB and using it, find what will be the population in the year 2010 ?Solution in Punjabi
Step by step video & image solution for Consider the following Population-Year Graph : Find the slope of the line AB and using it, find what will be the population in the year 2010 ? by Maths experts to help you in doubts & scoring excellent marks in Class 11 exams.
Updated on:21/07/2023Topper's Solved these Questions
Similar Questions
What is the slope of the line whose inclination is :
0∘ ?
View SolutionFind the mean deviation from the mean for the following data : 6,7,10,12,13,4,8,12.
View SolutionFind the radian measure corresponding to the following degree measure 15°
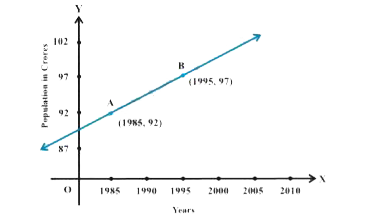
View SolutionConsider the following population and year graph, find the slope of the line AB and using it, find what will be the population in the year 2010?

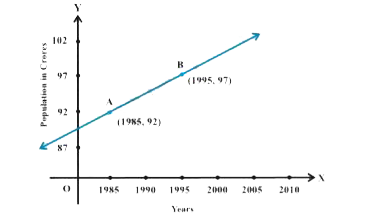
View SolutionConsider the following population and year graph: find the slope of the line AB and using it find what will be the population in the year 2010.
View SolutionDetermine the point of symmetry of a regular hexagon.
View SolutionMatch the following Column A to Column B

View SolutionMatch the following Column A to Column B

View SolutionMatch the following Column A to Column B

View SolutionThe inequation represented by the graph given below is :
View SolutionThe inequation that best describes the graph given below is _________
View SolutionThe inequation that best describes the following graph is _________
View Solutionजनसँख्या और वर्ष के निमिन्लिखित लेखाचित्र पर विचार कीजिए तथा रेखा ABकी ढाल ज्ञात कीजिए और इसके प्रयोग से बताईए की वर्ष 2010 में जनसँख्या कितनी होगी
View SolutionConsider the following population and year graph. Find the slope of the line AB and using it, find what will be the population in the year 2010?
View SolutionConsider the following population and year graph (Fig 10.10), find the slope of the line AB and using it, find what will be the population in the year 2010?

View SolutionConsider the following population and year graph (Fig 10.10), find the slope of the line AB and using it, find what will be the population in the year 2010?

View Solution
