Define resistivity of a conductor. Plot a graph showing the variation of resistivity with temperature for a metallic conductor. How does one explain such a behaviour using the mathematical expression of the resistivity of a material.
We know that R = ρl/AIf l = 1 A = 1 => ρ = RThus resistivity of a material is numerically equal to the resistance of the conductor having unit length and unit cross-sectional area. The resistivity of a material is found to be dependent on the temperature. Different materials do not exhibit the same dependance on temperatures. Over a limited range of temperatures that is not too large the resistivity of a metallic conductor is approximately given by ρT = ρ0 [1 + αT -T0] …1 where ρT is the resistivity at a temperature T and ρ0 is the same at a reference temperature T0. α is called the temperature co-efficient of resistivity. The relation of Eq. 1 implies that a graph of ρT plotted against T would be a straight line. At temperatures much lower than 0°C the graph however deviates considerably from a straight line Figure.
Related Solutions
Define resistivity of a conductor. Plot a graph showing the variation of resistivity with temperature for a metallic conductor. How does one explain such a behaviour, using the mathematical expression of the resistivity of a material
View SolutionDefine resistivity of a conductor. Plot a graph showing the variation of resistivity with temperature for a metallic conductor. How does one explain such a behaviour, using the mathematical expression of the resistivity of a material
View SolutionDefine resistivity of a conductor. Explain the variation of resistance with temperature in semiconductors.
View SolutionDefine the electric resistivity of conductor. Plot a graph showing the variation of resistivity with temperature in the case of a (a) conductor (b) semiconductor .Briefly explain, how the difference in the behaviour of the two can be explained in terms of number density of charge carriers and relaxation time.
View SolutionWrite a note on the variation of resistance of a metallic conductor with temperature.
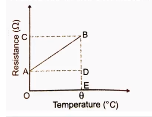
View SolutionThe variation of resistance of a metallic conductor with temperature is shown in figure. Calculate the temperature coefficient of resistance from the graph.

View SolutionDefine the term 'temperature coefficient of resistivity' . Write its S.I. unit. Plot a graph showing the variation of resistivity of copper with temperature.
View SolutionDefine temperature coefficient of resistance of the material of a conductor.
View SolutionShow, on a plot, variation of resistivity of (i) a conductor, and (i) a typical semiconductor as a function of temperature.
Using the expression for the resistivity in terms of number density and relaxation time between the collisions, explain how resistivity in thc casce of a conductor increases while it decrcases in a semiconductor, with the rise of temperature.
View SolutionHow does electrical resistivity of the following classes of materials vary with temperature ? Semiconductor, metallic conductor, super conductor.
View SolutionShow on graph, the variation of resistivity with temperature for a typical semiconductor. What is the order of resistivity of an conductor, semiconductor, Insulator ?
View SolutionThe variation of resistance of a metallic conductor with temperature is shown in figure. (i) Calculate the temperature coefficient of resistance from the graph. (ii) State why the resistance of the conductor increases with the rise in temperature.
View SolutionDraw graphs to show the variation of resistance with temperature for (a) Conductors (b) Semi conductors © Some alloys, (for which a = zero)
View SolutionThe resistance of a conductor does not depend on the nature of material of the conductor.
View SolutionDefine electrical resistivity of a material of a conductor.
View SolutionDefine electrical resistivity of material of a conductor.
View SolutionWrite an expression for the resistivity of a metallic conductor showing its variation over a limited range of temperatures.
View SolutionVariation of resistance of semiconductor with temperature is represented by which graph?
View SolutionWhen the temperature of a metallic conductor is raised, the resistance of the conductor
View SolutionVariation of resistance of the conductor with temperature is shown . Temperature coefficient of the conductor is
View Solution