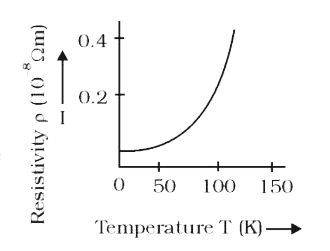
Define resistivity of a conductor. Plot a graph showing the variation of resistivity with temperature for a metallic conductor. How does one explain such a behaviour, using the mathematical expression of the resistivity of a material
Text Solution
We know that,R=p1A, IF
Thus, resistivity of a material is numerically equal to the resistance of the conductor having unit length and unit cross-sectional area
The resistivity of a material is found to be dependent on the temperature. Different materials do not exhibit the same dependence on temperatures. Over a limited range of temperatures, that is not too large, the resistivity of a metallic conductor is approximately given by,
.PT=p0[1+a(T−T0)] ...........(i)
Where pT is the resistivity at a temperature T and p0 is the same at a reference temperatureT0 is called the temperature co-efficient of resistivity.
The relation of equation (i) implies that a graph of pT plotted against T would be a straight line. At temperatures much lower than 0∘C, the graph, however, deviates considerably from a straight line (fig.)
Resistivity pT of metallic conductor as a function of temperature T.

|
Similar Questions
Knowledge Check
When the temperature of a metallic conductor is increased, its resistance
Aalways decreasesBalways increasesCmay increases or decreasesDremains constantHow does the ratio of resistivity to conductivity changes when temperature of a conductor is increased?
AIncreasesBDecreasesCRemain constantDCannot say anythings
Show on a graph, the variation of resistivity with temperature for a typical semiconductor.
View SolutionShow variation of resistivity of SI with temperature in a graph.
View SolutionExplain with the help of a graph the variation of conductivity with temperature of a metallic conductor.
View SolutionDefine the terms resistivity and conductivity and state their S. I. units. Draw a graph showing the variation of resistivity with temperature for a typical semiconductor.
View SolutionShow variation of resistivity of copper as a function of temperature in a graph.
View SolutionShow variation of resistivity of copper as a function of temperature in a graph.
View Solution
