Write a computer program that lists the states P T and v along the process curve
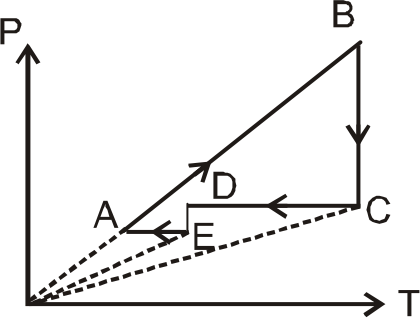
State 1: 250 kPa 300°C = 573 KState 2: 162.5 kPa 372.5 KState 3: 162.5 kPa 293 KSince we have an ideal gas the relations among the pressure temperature and the volume are very simple. The process curves are shown in the figure below.
Related Solutions
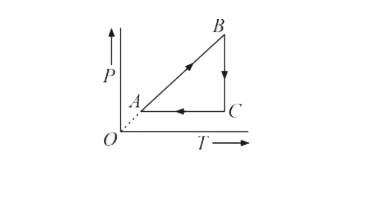
curve for a cyclic process is as shown

graph for this process will be:
View Solutionp-T curve for a cyclic process is as shown P-V graph for this process will be:
View Solution_______ button at the left corner of the computer, it shows the list of all programs in the computer.
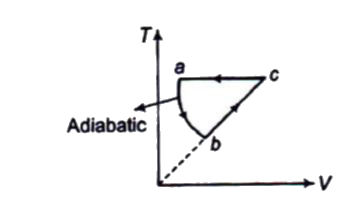
View SolutionThe V-T curve for the given process is given below. What will be its following P-V curve

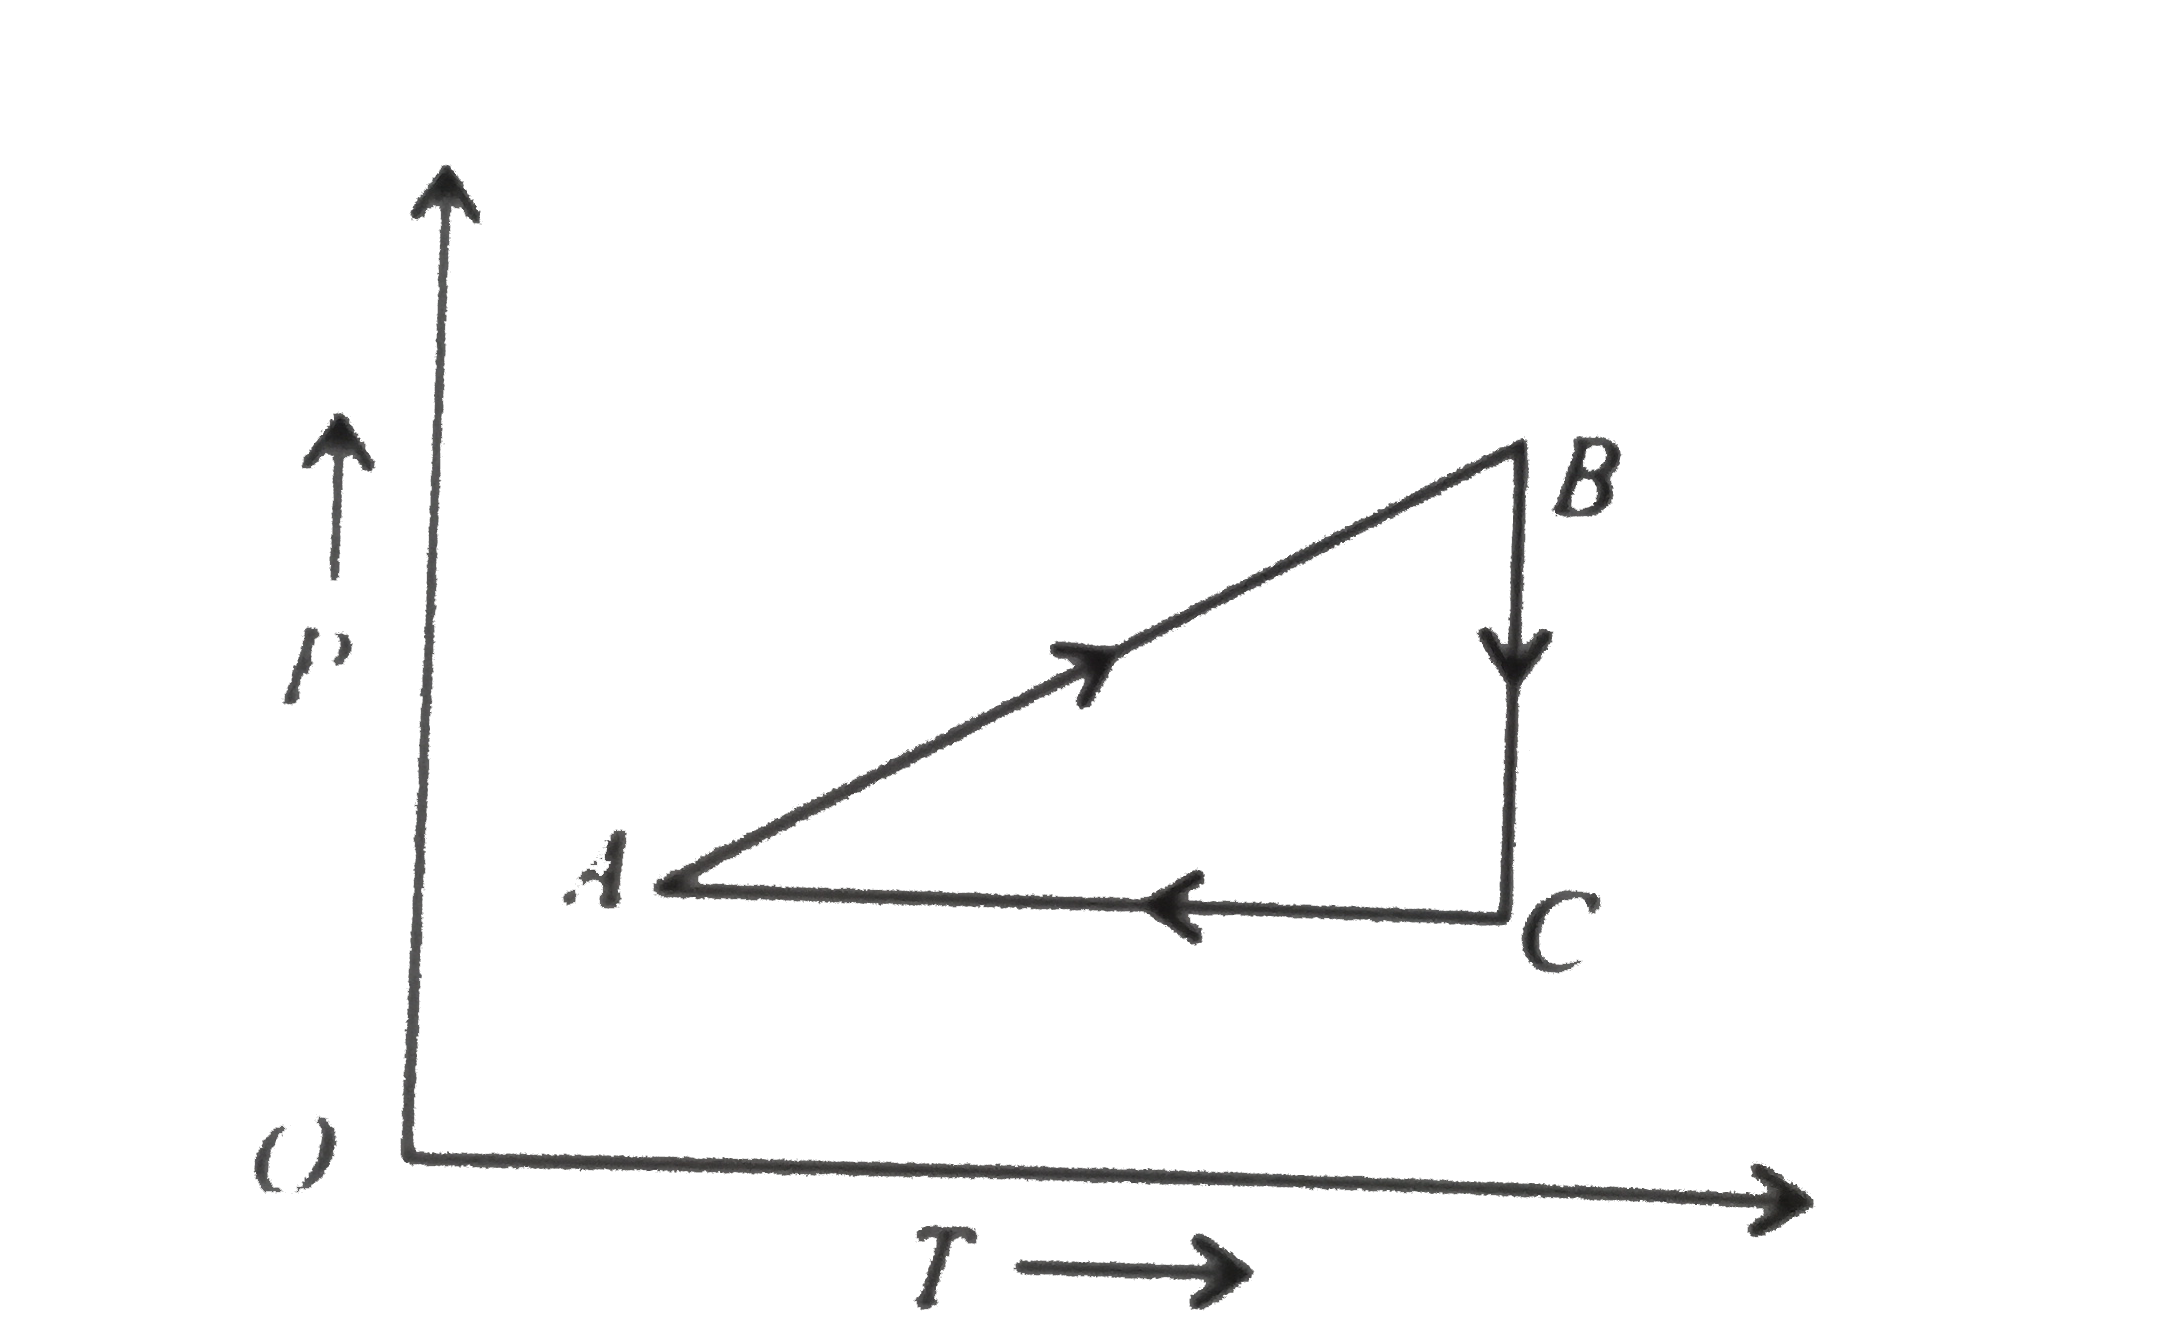
View SolutionA cyclic process is shown in the diagram. Which of the curves show the same process on a diagram?

View SolutionA cyclic process is shown in the diagram.

Which of the curve shows the same process on a diagram?
View SolutionA cyclic process is shown on the P-T diagram. Which of the curve shown the same process on a V-T diagram?
View SolutionA cyclic process is shown on the p-T diagram . Which of the curves show the same process on a V-T diagram?
View SolutionA cyclic process is shown in the p-T diagram. Which of the curves show the same process on a V-T diagram?
View SolutionA cyclic process is shown in the P – T diagram. Which of the curves show the same process on a V – T diagram?
View SolutionA cyclic process is shown in the p-T diagram. Which of the curves show the same process on a V-T diagram?
View SolutionA cyclic process is shown on the p-T diagram. Which of the curves show the same process on a V-T diagram ?
View SolutionA cyclic process is shown in the diagram. Which of the curves show the same process on a diagram?

View SolutionA cyclic process is shown in the diagram.

Which of the curve shows the same process on a diagram?
View SolutionA cyclic process is shown in the P-T diagram. Which of the curves show the same process on a P-V diagram ?
View SolutionA cyclic process is shown in the p – T diagram . Which of the following curves shows the same process on the p – V diagram ?
View SolutionA cyclic process is shown ion the p-T diagram. Which of the curves show the same process on a p-V diagram ?
View SolutionA cyclic process is shown in the p – T diagram . Which of the following curves shows the same process on the p – V diagram ?
View SolutionWrite down the relation for an adiabatic process in terms of (i) P and V (ii) T and V and (iii) P and T.
View Solution______ button at the left corner of the computer and shows the list of all programs.
View Solution