Draw the lowest order Feynman diagram at the quark level for the following decays a Λ → p + e− + bar νe b D− → K0 + π−
a Λ → p + e− + bar νe
Related Solutions
सजीव जगत में संगठन के निम्न स्तर का रेखा चित्र बनाइए।
View SolutionThe value of lim_(x to oo ) (log_(e)(log_(e)x))/(e^(sqrt(x))) is _________. (a) π/ 2 (b)0 (c)-π (d)π
View SolutionThe value of is _________. (a) π/ 2 (b)0 (c)-π (d)π
View SolutionDraw a bar diagram of the following data.
 View Solution
Draw a bar-diagram of the following data.
 View Solution
Draw energy level diagram for molecule.Calculate its bond order.
View SolutionDraw a bar diagram representing the following data.
 View Solution
Draw a multiple bar diagram to show the following data :
 View Solution
Draw energy level diagram, showing the position of donor level and acceptor level inn-type and p-type semiconductor.
View SolutionIf bar E and bar F are the complementary events of events E and F , respectively, and if 0 < P(F)<1, then a. P(E/F)+P( bar E / F )=1 b. P(E/F)+P(E/bar F )=1 c. P( barE /F)+P(E/ bar F )=1 d. P(E/ barF )+P( bar E / bar F )=1
View Solutionहाइड्रोजन परमाणु के लिए ऊर्जा-स्तर आरेख खींचकर उसकी निम्नतम अवस्था तथा उत्तेजित अवस्था को समझाइए।
View SolutionDraw energy level diagram for Hydrogen atom showing at least four lowest energy levels. Show the transitions responsible for emission of Balmer series.
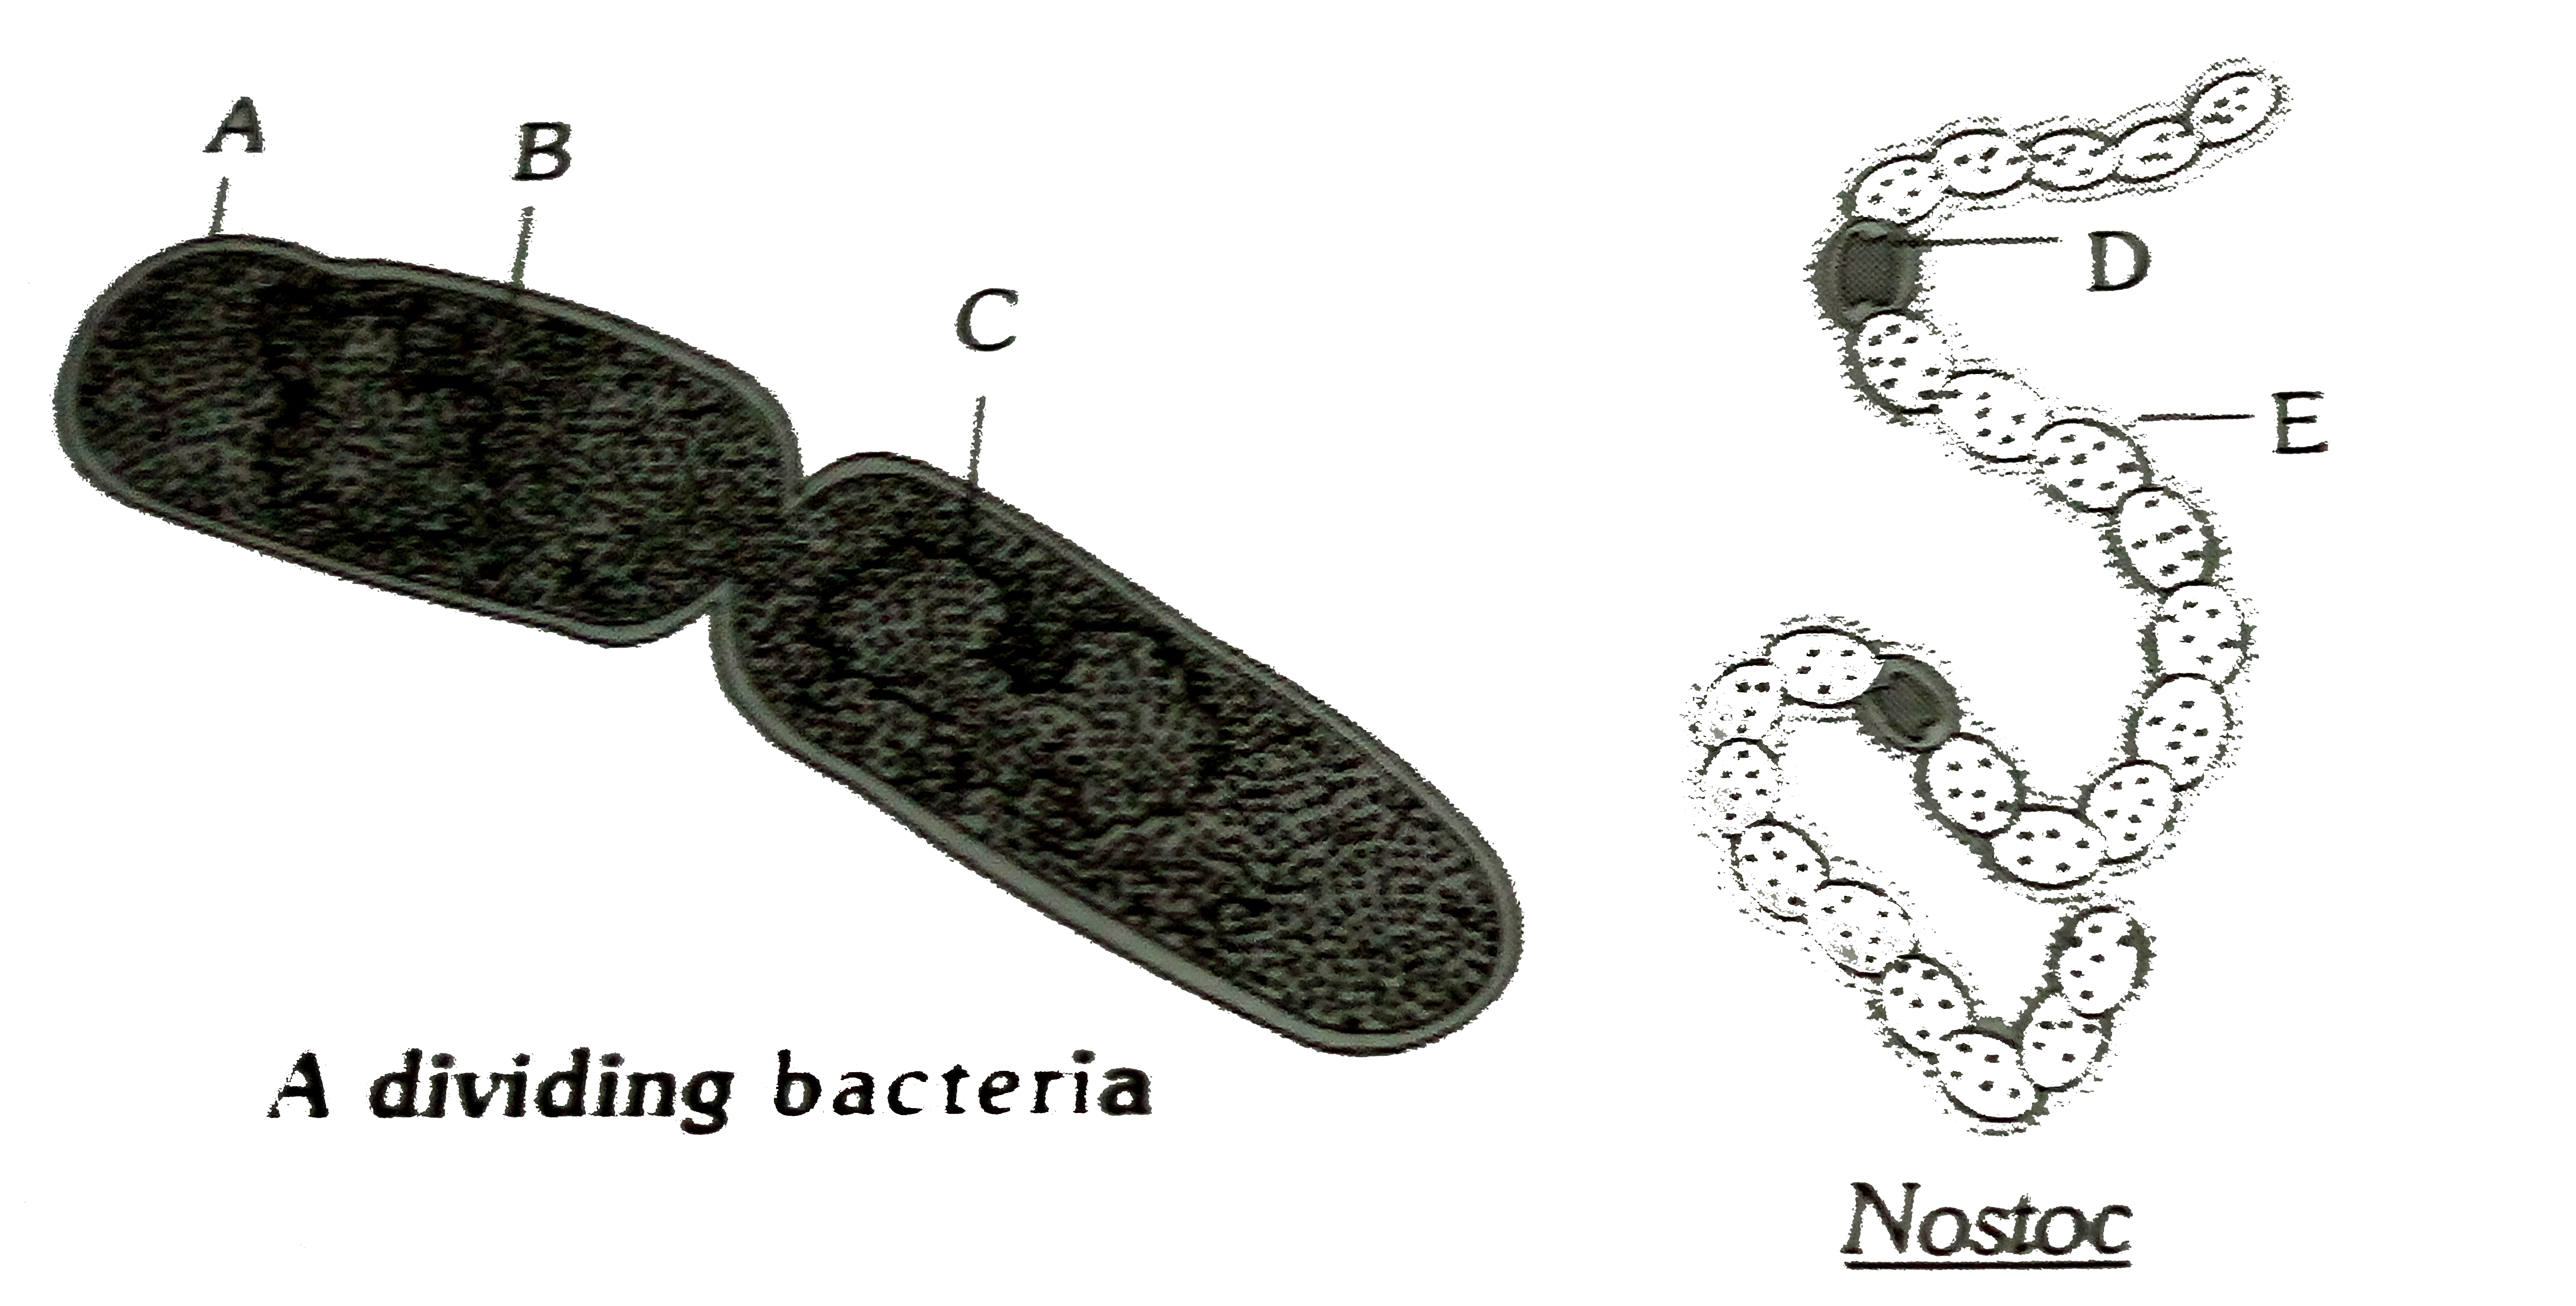
View SolutionIdentify the A, B, C, D and E in the following diagram
 View Solution
Draw the level diagram of a Daniell cell.
View SolutionWhat is the energy level diagram for an atom? Calculate the energies of the various energy levels of a hydrogen atom and draw an energy level diagram.
View SolutionEvaluate : . a) b) c) d)
View SolutionDifferentiate between multiple bar diagram and compound bar diagram.
View SolutionDraw energy level diagram for Balmer series for transition between eriergy levels.
View SolutionDraw the different energy level diagram for a hygrogen atom.
View SolutionDraw neat labelled diagram of Trophic levels.
View Solution
