Observe the chart and graph given in Fig. 10.3 carefully and answer the following questions.Age inYears% of full heightBoysGirls872%77%975%81%1078%84%1181%88%1284%91%1388%95%1492%98%1595%99%1698%99.5%1799%100%18100%100%Fig.10.3a Which of the line represents the height of boys? b Which line represents the height of girls? c What is the difference between the pattern of increase in the height of boys and girls? d Is this pattern true for each individual?
a The red line represents the height of boys. b The blue line represents the height of girls. c At the onset of puberty girls grow faster in height than the boys and by the age of 18 years approximately both reach their maximum height. d No the rate of growth in height varies among individuals. Some may grow in height suddenly at puberty and then slow down while others may grow gradually.
Related Solutions
Look carefully at the chart and graph shown in the figure given below and answer the given questions. (a) Which line represents the height of the boys? (b) Which line represents the height of the girls? (c) What is the difference in the growth pattern of boys and girls? (d) Is this pattern true for each person?
View SolutionThe given bar graph represents the number of boys and girls in five different schools. Read the graph and answer the question that follows. What is the average number of students (girls and boys) in schools A, B, C, D and E ?
View Solutionఒక పాఠశాలలోని 9 వ తరగతి బాల బాలికల ఎత్తుల వివరాలు ఈ విధంగా ఉన్నవి. బాల బాలికల ఎత్తులను పొల్చండి . [సూచన: బాలబాలికల మధ్యగత ఎత్తును కనుగొనండి.]

View SolutionThe given bar graph represents the number of boys and girls in five different schools. Study the graph and answer the question that follows In which school is the percentage of girls the lowest ?
View SolutionThe heights of boys and girls of IX class of a school are given below.

Compare the heights of the boys and girls.
View SolutionThe heights of boys and girls of IX class of a school are given below.

Compare the heights of the boys and girls.
View SolutionThe heights of boys and girls of IX class of a school are given below.
Compare the heights of the boys and girls.
View SolutionThe heights of boys and girls of IX class of a school are given below.

Compare the heights of the boys and girls.
View SolutionThe heights of boys and girls of IX class of a school are given below.

Compare the heights of the boys and girls.
View SolutionNumber of ways in which 4 boys and 2 girls (all are of different heights) can be arranged in a line so that boys a well as girls among themselves are in decreasing order of height (from left to right),is
View SolutionRead the following graph carefully and answer the questions given below:

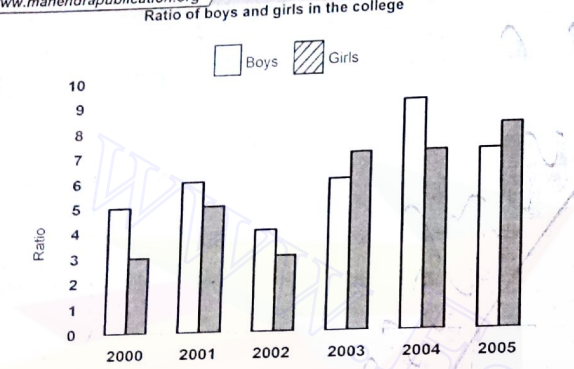
What is the difference between the number of boys and girls in the year 2004 ?
View Solutionलड़के और लड़कियों की लंबाई में परिवर्तन किसमें ज्यादा होता है
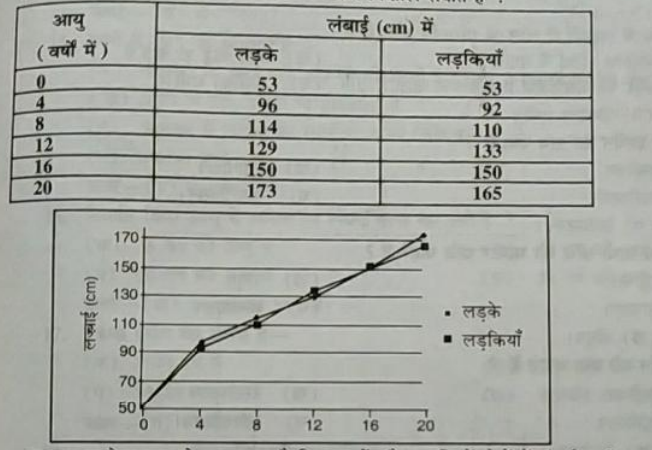
View Solutionनीचे दी गई सारणी में आयु वृदधि के अनुपात में लड़कों एवं लड़कियों की अनुभानित लंबाई के । आँकड़े दर्शाएं गए हैं। लड़के एवं लड़कियां दोनों की लंबाई एवं आयु को प्रदर्शित करते हुए एक ही कागज पर ग्राफ खींजिए। इस ग्राफ से आप क्या निष्कर्ष निकाल सकते हैं ?
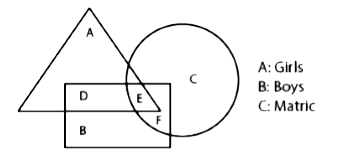
View SolutionIn the given figures, triangle represents girls studying in a girls school, square represents boys studying in boys school and circle represents students studying in matriculation school. The portion which represent girls and boys studying in matriculation school is
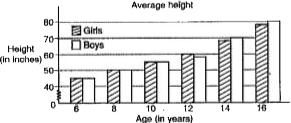
View SolutionThe given double graph shows the average heights of boys and girls at specific ages. Which conclusion is supported by the graph ?
View Solutionनीचे दी गई सारणी में आयु वृदधि के अनुपात में लड़कों एवं लड़कियों की अनुभानित लंबाई के । आँकड़े दर्शाएं गए हैं। लड़के एवं लड़कियां दोनों की लंबाई एवं आयु को प्रदर्शित करते हुए एक ही कागज पर ग्राफ खींजिए। इस ग्राफ से आप क्या निष्कर्ष निकाल सकते हैं ?

View SolutionThe table below shows the approximate heights of boys and girls in proportion to their age. Draw a graph on the same graph paper showing the height and age of both boys and girls. What can you conclude from this graph?
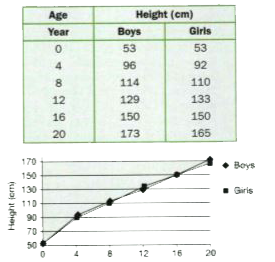
View SolutionThe table below shows the data on likely heights of boys and girls as they grow in age. Draw graphs showing height and age for both boys and girls on the same graph paper. What conclusions can be drawn from these graphs ?
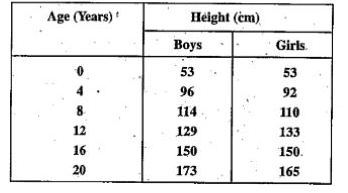
View SolutionThe table below shows the data on likely heights of boys and girls as they grow in age. Draw graphs of height and age for both boys and girls on the same graph paper. What conclusions can be drawn from these graphs?
View SolutionAverage of the height of 251 students of a school is 48. If the average of the height of the boys Is 51 and the average of the height of the girls is 29, then what will be the ratio of the total height of boys and the total height of girls respectively?
View Solution