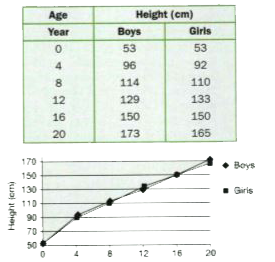
The given double graph shows the average heights of boys and girls at specific ages. Which conclusion is supported by the graph ?
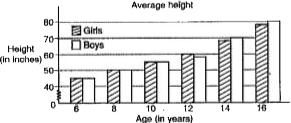
Girls are taller than boys until the age of 14
Girls and boys grow the same amount each year.
After the ago of 14 , boys grow faster than girls
Boys are always taller than girls
The correct Answer is:C
Step by step video, text & image solution for The given double graph shows the average heights of boys and girls at specific ages. Which conclusion is supported by the graph ? by Maths experts to help you in doubts & scoring excellent marks in Class 7 exams.
Updated on:21/07/2023Topper's Solved these Questions
- DATA HANDLING BOOK - S CHAND IIT JEE FOUNDATIONCHAPTER - DATA HANDLING EXERCISE - Question Bank - 24 (b)
15 Videos
- DATA HANDLING BOOK - S CHAND IIT JEE FOUNDATIONCHAPTER - DATA HANDLING EXERCISE - Self Assessment Sheet - 24
10 Videos
- DATA HANDLING BOOK - S CHAND IIT JEE FOUNDATIONCHAPTER - DATA HANDLING EXERCISE - Self Assessment Sheet - 24
10 Videos
- CIRCUMFERENCE AND AREA OF A CIRCLE BOOK - S CHAND IIT JEE FOUNDATIONCHAPTER - CIRCUMFERENCE AND AREA OF A CIRCLE EXERCISE - SELF ASSESSMENT SHEET - 22
10 Videos
- DECIMALS BOOK - S CHAND IIT JEE FOUNDATIONCHAPTER - DECIMALS EXERCISE - SELF ASSESSMENT SHEET
10 Videos
Similar Questions
Knowledge Check
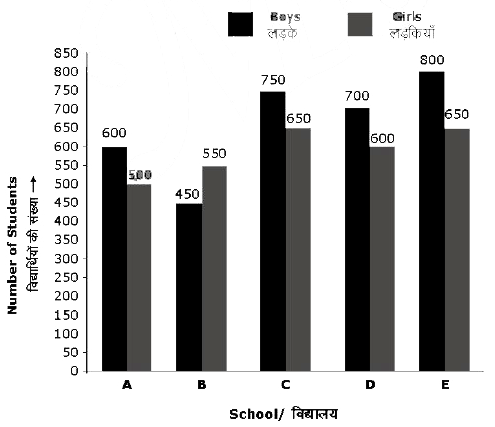
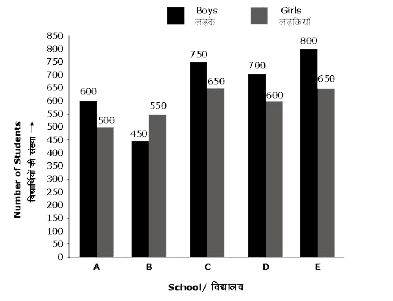
The given bar graph represents the number of boys and girls in five different schools. Study the graph and answer the question that follows
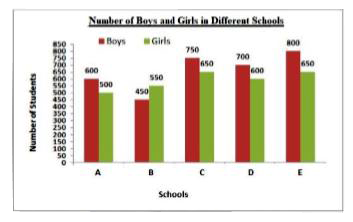
In which school is the percentage of girls the lowest ?AABBCEDCThe given bar graph represents the number of bodys and girls in five different schools. Study the graph and answer the question that follows
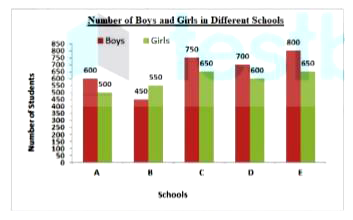
What is the average number of boys in schools A, B, C, D and E?A660B616C596D569The given bar graph represents the number of boys and girls in five different schools. Read the graph and answer the question that follows.
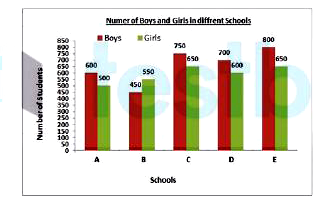
What is the average number of students (girls and boys) in schools A, B, C, D and E ?A596B1250C625D660
In the given bar graph what is the average number of girls in all colleges
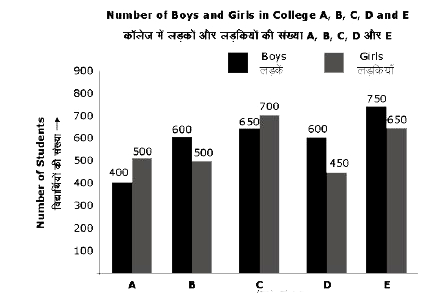
View SolutionIn the given bar graph, what is the ratio of the total boys and girls in all 5 colleges.
View SolutionThe given bar graph shows the heights of different buildings.
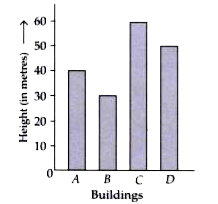
What is the height of building C ?
View SolutionThe table below shows the data on likely heights of boys and girls as they grow in age. Draw graphs of height and age for both boys and girls on the same graph paper. What conclusions can be drawn from these graphs?
View SolutionThe bar graph given below shows the interest of boys and girls in different activities
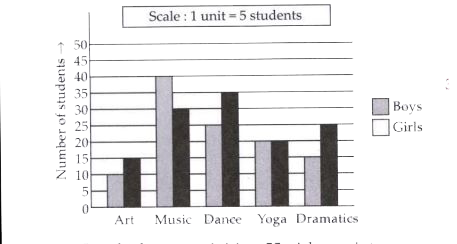
In which two activities, 55 girls are interested together ?
View Solution

