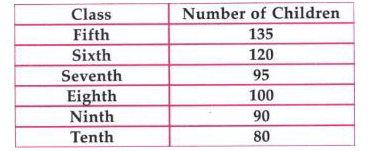
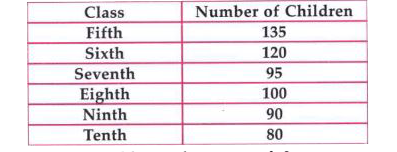
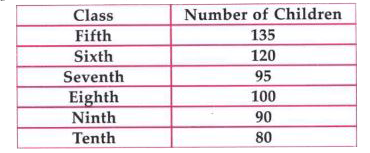
Number of children in six different classes are given below. Represent the data on a bar graph.classFifthSixthSeventhEighthNinthTenthno. of children135120951009080a How would you choose a scale?b Answer the following questions:i Which class has the maximum number of children? And the minimum?ii Find the ratio of students of class sixth to the students of class eighth.
Data represented by the bar graph is as follows:a Scale: 1 unit = 25 children bi Fifth class has the maximum number of children and Tenth class has the minimum number of childrenii Ratio =
Related Solutions
Number of children in six different classes are given below. Represent the data on a bar graph.(a) How would you choose a scale.(b) Answer the following questions:(i) Which class has the maximum number of children? And the minimum?(ii) Find the ratio of students of class sixth to the students of class eight.
View SolutionNumber of children in six different classes are given below. Represent the data on a bar graph
.(a) How would you choose a scale
.(b) Answer the following questions:
(i) Which class has the maximum number of children? And the minimum?
(ii) Find the ratio of students of class sixth to the students of class eight.

View SolutionNumber of children in six different classes are given below.
Which class have the second highest strength ?
View SolutionNumber of children in six different classes are given below. Represent the data on a bar graph.

How would you choose a scale?
View Solutionछः विभिन्न कक्षाओं के विद्यार्थियों कि संख्याएँ नीचे दी गयी हैं। इन आँकड़ो को एक दंड आलेख द्वारा निरूपित कीजिये :

(a) आप स्केल किस प्रकार चुनेंगे?
(b) निम्नलिखित प्रश्नों के उत्तर दीजिए :
(i) किस कक्षा में विद्यार्थियों की संख्या अधिकतम है? किस कक्षा में न्यूनतम है?
(ii) कक्षा 6 के विद्यार्थियों की संख्या का कक्षा 8 के विद्यार्थियों की संख्या से अनुपात ज्ञात कीजिए।
View SolutionNumber of children in six different classes are given below. Represent the data on a bar graph.

Answer the following question:
Which has the maximum number of children? And the minimum?
View Solutionछः विभिन्न कक्षाओं के विद्यार्थियों कि संख्याएँ नीचे दी गयी हैं। इन आँकड़ो को एक दंड आलेख द्वारा निरूपित कीजिये : आप स्केल किस प्रकार चुनेगे ?

View Solutionछः विभिन्न कक्षाओं के विद्यार्थियों कि संख्याएँ नीचे दी गयी हैं। इन आँकड़ो को एक दंड आलेख द्वारा निरूपित कीजिये : निम्नलिखित प्रश्नो के उत्तर दीजिये : किस कक्षा में विद्यार्थियों कीसंख्या अधिकतम हैं ? किस कक्षा में न्यून्तम हैं ?

View Solutionਛੇ ਵੱਖ-ਵੱਖ ਜਮਾਤਾਂ ਦੇ ਵਿਦਿਆਰਥੀਆਂ ਦੀ ਸੰਖਿਆ ਹੇਠਾਂ ਦਿੱਤੀ ਗਈ ਹੈ। ਇਹਨਾਂ ਅੰਕੜਿਆਂ ਨੂੰ ਇੱਕ ਛੜ ਗ੍ਰਾਫ ਨਾਲ ਦਰਸਾਓ:
 ਹੇਠ ਲਿਖੇ ਪ੍ਰਸ਼ਨ ਦੇ ਉੱਤਰ ਦਿਉ: ਛੇਵੀਂ ਜਮਾਤ ਦੇ ਵਿਦਿਆਰਥੀਆਂ ਦੀ ਸੰਖਿਆ ਅੱਠਵੀਂ ਜਮਾਤ ਦੇ ਵਿਦਿਆਰਥੀਆਂ ਦੀ ਸੰਖਿਆ ਦਾ ਅਨੁਪਾਤ ਪਤਾ ਕਰੋ।
View Solutionਛੇ ਵੱਖ-ਵੱਖ ਜਮਾਤਾਂ ਦੇ ਵਿਦਿਆਰਥੀਆਂ ਦੀ ਸੰਖਿਆ ਹੇਠਾਂ ਦਿੱਤੀ ਗਈ ਹੈ। ਇਹਨਾਂ ਅੰਕੜਿਆਂ ਨੂੰ ਇੱਕ ਛੜ ਗ੍ਰਾਫ ਨਾਲ ਦਰਸਾਓ:
 ਹੇਠ ਲਿਖੇ ਪ੍ਰਸ਼ਨ ਦੇ ਉੱਤਰ ਦਿਉ: ਕਿਹੜੀ ਜਮਾਤ ਵਿਚ ਵਿਦਿਆਰਥੀਆਂ ਦੀ ਸੰਖਿਆ ਵੱਧ ਤੋਂ ਵੱਧ ਹੈ? ਕਿਹੜੀ ਜਮਾਤ ਵਿਚ ਘੱਟ ਤੋਂ ਘੱਟ ਹੈ?
View SolutionObserve the following data:
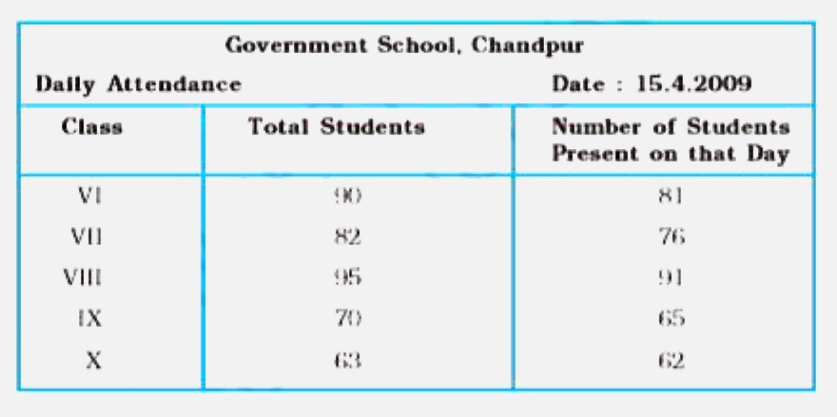
(a) Draw a double bar graph choosing an appropriate scale. What do you infer from the bar graph?
(b) Which class has the maximum number of students?
(c) In which class, the difference of total students and number of students present is minimum?
(d) Find the ratio of number of students present to the total number of students of Class IX.
(e) What per cent of Class VI students were absent?
View SolutionAnswer the following questions
Which class has the maximum number of children ? And the minimum ?
View SolutionThe given bar graph, shows the number of students in different classes. Find the total number of students in the classes VIII to X.
View SolutionDirection: There are 1250 total students in 5 different classes in a school. The number of students in class I is 50 less than the number of students in class II. The number of class IV students is 50 more than the number of students in class II. The average number of students in class III and class V is 250. The number of students in class III is 10% less than the number of students in class I. The ratio of the total number of students of class V to the total number of students of class III is
View Solutionਛੇ ਵੱਖ-ਵੱਖ ਜਮਾਤਾਂ ਦੇ ਵਿਦਿਆਰਥੀਆਂ ਦੀ ਸੰਖਿਆ ਹੇਠਾਂ ਦਿੱਤੀ ਗਈ ਹੈ। ਇਹਨਾਂ ਅੰਕੜਿਆਂ ਨੂੰ ਇੱਕ ਛੜ ਗ੍ਰਾਫ ਨਾਲ ਦਰਸਾਓ:
 ਤੁਸੀਂ ਕਿਸ ਪ੍ਰਕਾਰ ਦਾ ਸਕੇਲ ਚੁਣੋਗੇ?
View SolutionDirection: There are 1250 total students in 5 different classes in a school. The number of students in class I is 50 less than the number of students in class II. The number of class IV students is 50 more than the number of students in class II. The average number of students in class III and class V is 250. The number of students in class III is 10% less than the number of students in class I.
The total number of students of class IV and the number of students of class II is
View SolutionAnswer the following questions
Find the ratio of students of class sixth to the students of class eight
View SolutionDirection: There are 1250 total students in 5 different classes in a school. The number of students in class I is 50 less than the number of students in class II. The number of class IV students is 50 more than the number of students in class II. The average number of students in class III and class V is 250. The number of students in class III is 10% less than the number of students in class I.
The average number of students of class II and class III is
View Solutionनीचे एक आयत-चित्र द्वारा किसी कक्षा के छात्रों के प्राप्तांक दर्शाये गये हैं
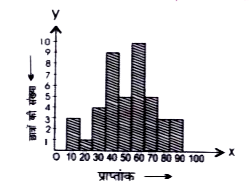
किस प्राप्तांक-वर्ग वाले छात्रों की संख्या अधिकतम हैं और किस प्राप्तांक-वर्ग वाले छात्रों की संख्या निम्नतम हैं ?
View Solution