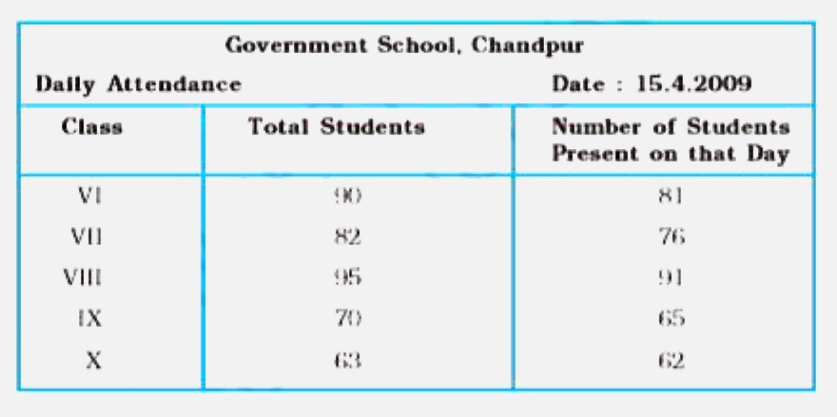
Observe the following data:

(a) Draw a double bar graph choosing an appropriate scale. What do you infer from the bar graph?
(b) Which class has the maximum number of students?
(c) In which class, the difference of total students and number of students present is minimum?
(d) Find the ratio of number of students present to the total number of students of Class IX.
(e) What per cent of Class VI students were absent?
Step by step video & image solution for Observe the following data: (a) Draw a double bar graph choosing an appropriate scale. What do you infer from the bar graph? (b) Which class has the maximum number of students? (c) In which class, the difference of total students and number of students present is minimum? (d) Find the ratio of number of students present to the total number of students of Class IX. (e) What per cent of Class VI students were absent? by Maths experts to help you in doubts & scoring excellent marks in Class 7 exams.
Updated on:21/07/2023Topper's Solved these Questions
- DATA HANDLINGBOOK - NCERT EXEMPLARCHAPTER - DATA HANDLINGEXERCISE - THINK AND DISCUSS
3 Videos
- DATA HANDLINGBOOK - NCERT EXEMPLARCHAPTER - DATA HANDLINGEXERCISE - EXERCISE(TRUE OR FALSE)
18 Videos
- COMPARING QUANTITIESBOOK - NCERT EXEMPLARCHAPTER - COMPARING QUANTITIESEXERCISE - THINK AND DISCUSS
24 Videos
- EXPONENTS AND POWERSBOOK - NCERT EXEMPLARCHAPTER - EXPONENTS AND POWERSEXERCISE - EXERCISE
136 Videos
Similar Questions
On a particular day in a school, the attendance in each of the classes from VI to X has been recorded as under
Draw a double bar graph, choosing an appropriate scale. Using the bar graph, answer the questions given below

(i) Which class has the maximum number of students (ii) Find the ratio of number of students present to the total number of students in Class VII. (iii) What percent of Class IX students were absent
View SolutionThere are 20 girls and 15 boys in a class.
What is the ratio of number of girls to the total number of students in the class?
View Solution
Knowledge Check
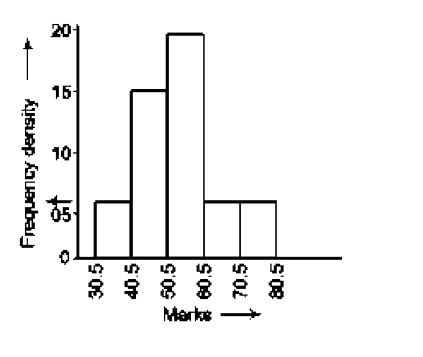
The class, in which the marks of maximum number of students lies, is
 A40.5 to 50.5B50.5 to 60.5C60.5 to 70.5D70.5 to 80.5
In a class, there are 225 students. Which of the following cannot be the ratio of the number of sutdents passed to the number of students failed?
A2:3B7:8C5:4D3:4There are 'b' boys and 'g' girls in a class. The ratio of the number of boys to the total number of students in the class is:
Abb+gBgb+gCbgDb+gb
There are 20 girls and 15 boys in a class.
What is the ratio of number of girls to the total number of students in the class?
View SolutionOut of 30 students in a class, 20 like cricket and 10 like Hockey. The ratio of the number of students liking Hockey to the total number of students is
View SolutionThere are ‘b’ boys and ‘g’ girls in a class. The ratio of the number of boys to the total number of students in the class is:
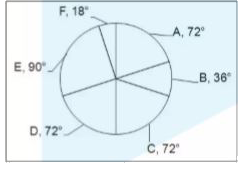
View SolutionThe pie chart given below shows the number of students in 6 different sections. The total number of students is 1800.

What is the ratio of number of students in section D to the number of students in section F and B?
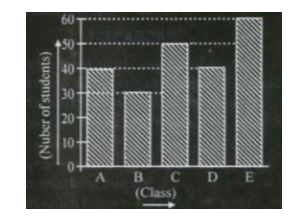
View SolutionFrom the following bar graph, find the class in which number of students are half of the other class :

View Solution