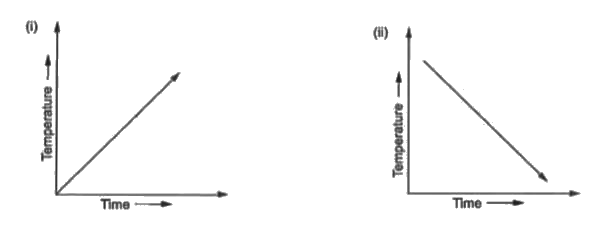
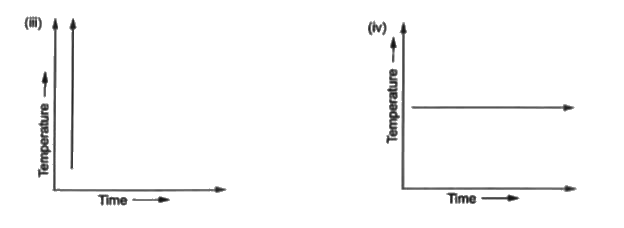
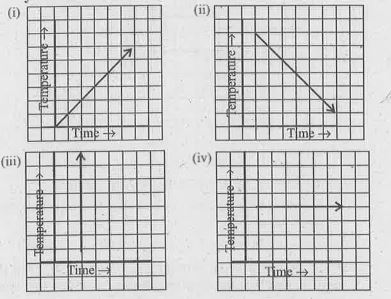
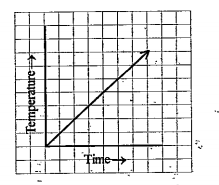
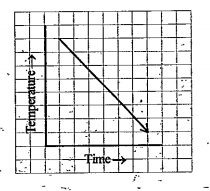
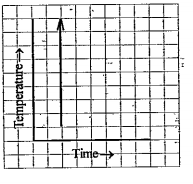
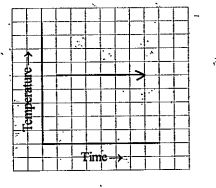
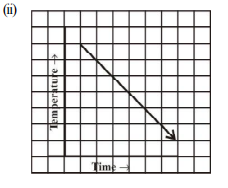
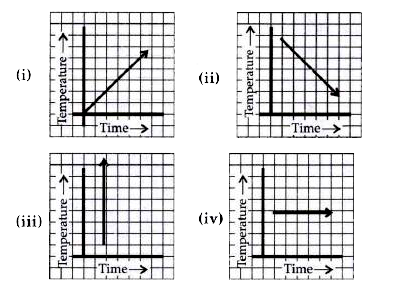
Can there be a time temperature graph as follows? Justify you’re answer:
i This can be a time−temperature graph as the temperature can increase with the increase in time.ii This can be a time−temperature graph as the temperature can decrease with the decrease in time.iii This cannot be a time−temperature graph since different temperatures at the same time are not possible.iv This can be a time−temperature graph as same temperature at different times is possible.
Related Solutions
Can there be a temperature- time graph as follows ? Justify your answer.
View SolutionCan there be a time-temperature graph as follows? Justify your answer.

View SolutionCan there be a time-temperature graph as follows? Justify your answer.
View SolutionCan there be a time-temperature graph as follows?Justify your answer.
View SolutionCan there be a time-temperature graph as follows? Justify your answer.
View SolutionCan there be a time-temperature graph as follows? Justify your answer.
View SolutionCan there be a time-temperature graph as follows? Justify your answer.
View SolutionCan there be a time-temperature graph as follows? Justify your answer.
View SolutionCan there be a time-temperature graph as follows? Justify your answer :
View SolutionCan there be a time- temperature graph as follows? Justify your answer.
View SolutionCan there be a time temperature graph as fallows ? Justify your answer .
(i)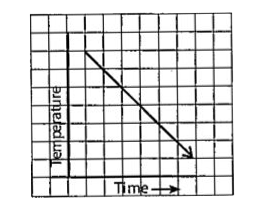
View SolutionCan there be a time temperature graph as fallows ? Justify your answer .
(i)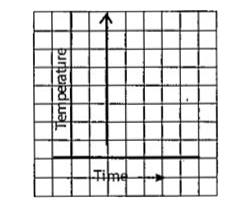
View SolutionCan there be a time temperature graph as fallows ? Justify your answer .
(i)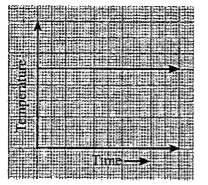
View SolutionAnswer the following questions : Explain the following temperature vs time graph
View SolutionDoes the following graph represent a function? Justify your answer.
View SolutionCan the following figures be parallelograms. Justify your answer.
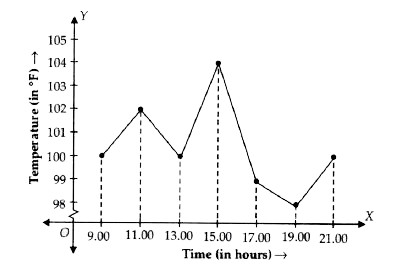
View SolutionObserve the graph and answer the following questions.
The temperature is maximum at
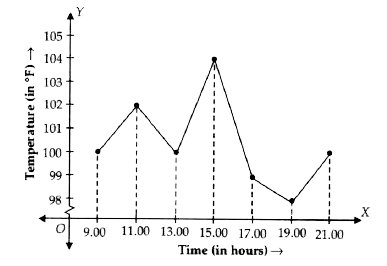
View SolutionObserve the graph and answer the following questions.
The temperature is minimum at
View Solutionएक निश्चित जल कि मात्रा को गर्म कर विभिन्न समयान्तरालों पर उसका तापमान निम्न प्रकार देखा गया :-

समय ताप मान ग्राफ t=0 से t=15 मिनट बनाइए। अपने ग्राफ का प्रयोग निम्न प्रश्नों का उत्तर देने में कजिए : -
कितने मिनट बाद तापमान 70 ∘ C होगा ?
View SolutionWith the help of graph answer the following At constant temperature At constant temperature
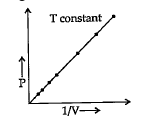
Identify the law.
View Solution