Answer the following questions :
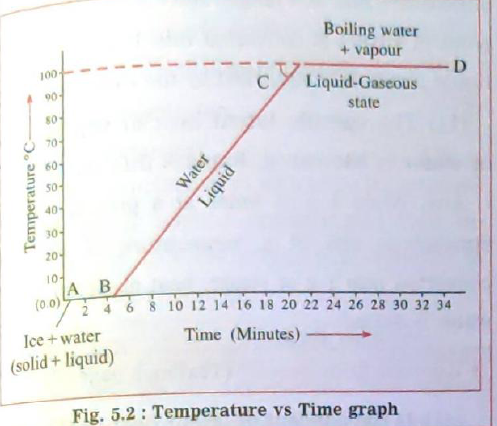
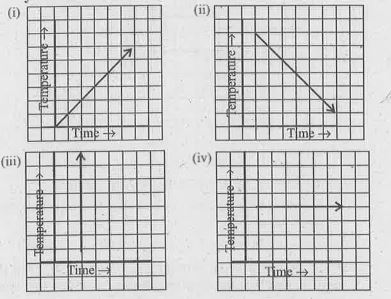
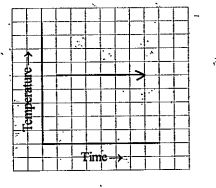
Explain the following temperature vs time graph
 Solution in Marathi
Step by step video & image solution for Answer the following questions : Explain the following temperature vs time graph by Physics experts to help you in doubts & scoring excellent marks in Class 10 exams.
Updated on:21/07/2023Topper's Solved these Questions
Similar Questions
Fill in the blanks and rewrite the sentences :
The amount of water vapour in air is determined in terms of its ……….
View SolutionFill in the blanks with appropriate words and write the completed sentences:
The ratio g_(earth) / g_(moon) is equal to....
View SolutionFill in the blanks :
The focal length of a ………… lens is positive.
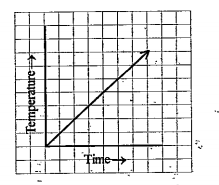
View SolutionCan there be a time-temperature graph as follows? Justify your answer.

View SolutionExplain the following temperature Vs. time graph:
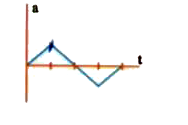
View SolutionWhich of the following v Vs t graph are correct representation for the acceleration Vs time graph shown below
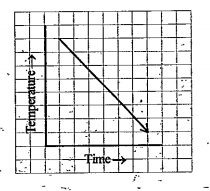
View SolutionCan there be a temperature- time graph as follows ? Justify your answer.
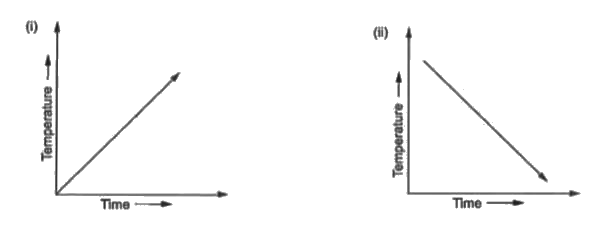
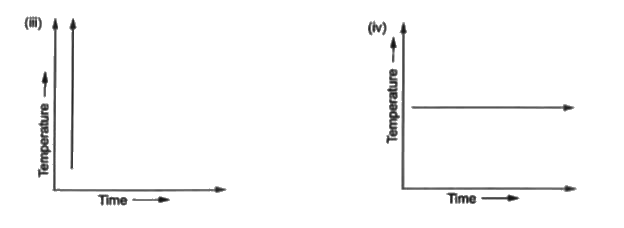
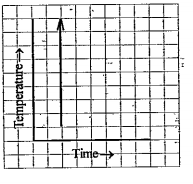
View SolutionCan there be a time-temperature graph as follows? Justify your answer.
View SolutionCan there be a time-temperature graph as follows?Justify your answer.
View SolutionCan there be a time-temperature graph as follows? Justify your answer.
View SolutionCan there be a time-temperature graph as follows? Justify your answer.
View SolutionCan there be a time-temperature graph as follows? Justify your answer.
View SolutionCan there be a time-temperature graph as follows? Justify your answer.
View Solutionएक निश्चित जल कि मात्रा को गर्म कर विभिन्न समयान्तरालों पर उसका तापमान निम्न प्रकार देखा गया :-

समय ताप मान ग्राफ t=0 से t=15 मिनट बनाइए। अपने ग्राफ का प्रयोग निम्न प्रश्नों का उत्तर देने में कजिए : -
कितने मिनट बाद तापमान 70 ∘ C होगा ?
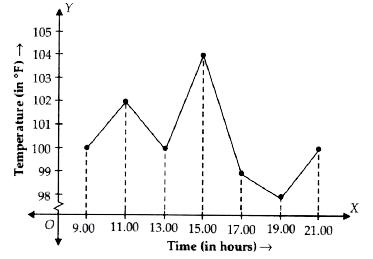
View SolutionObserve the graph and answer the following questions.
The temperature of the patient at 11.00 hours is
View Solution
