Attempt this question on graph paper.Ageyrs5-1515-2525-3535-4545-5555-6565-75No. of casualties61015132487i Construct the less than cumulative frequency curve for the above data. Using 2 cm = 10 yrs on one axis and 2 cm = 10 casualties on the other.ii From your graph determine:a the median b the lower quartile
Through 41.5th term mark draw a line parallel to the x - axis which meets the curve at A. From A draw a perpendicular to x - axis which meets it at B.
Related Solutions
Draw the less than cumulative frequency graph for he following data :
 View Solution
The distribution of heights (in cm) of 96 children is given below: Draw a less than type cumulative frequency curve for this data and use it to compute median height of the children.
View Solutionनिम्न आँकडों से एक संचयी बारंबारता बंटन की रचना कीजिए :

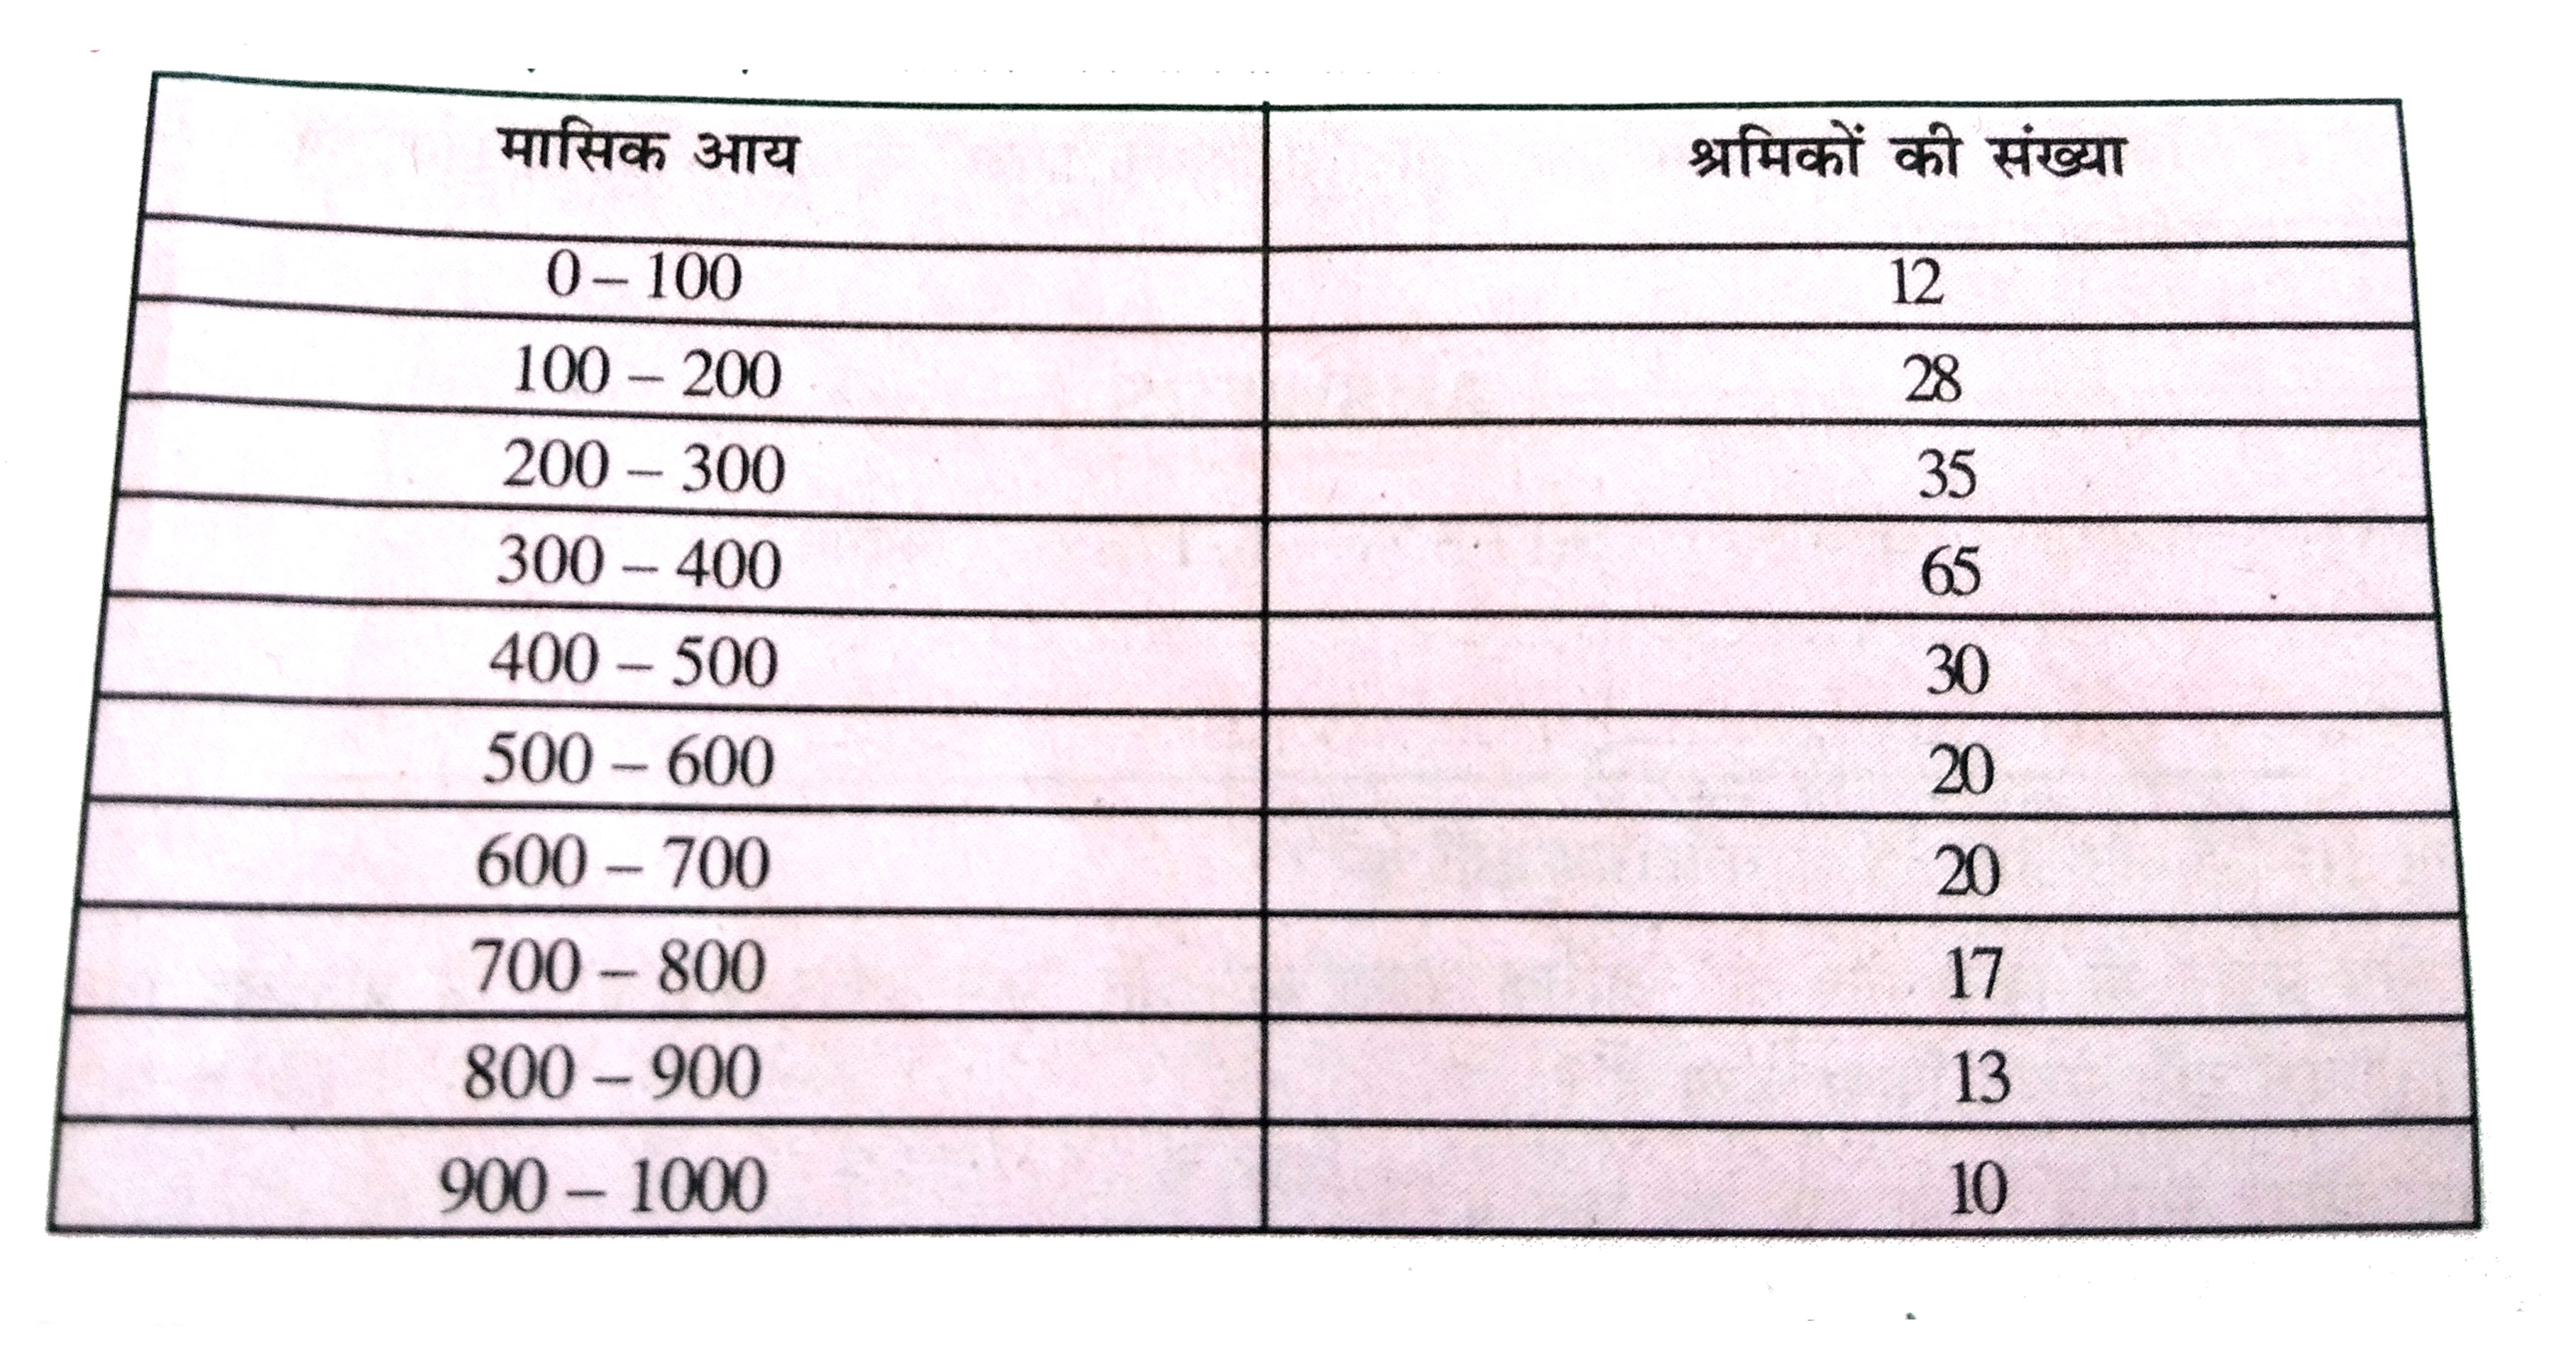
कितने विद्यार्थियों की ऊँचाई 150 सेमी से कम है ?View SolutionThe following table shows the distribution of salaries of a group of workers :

Determine cumulative frequencies
Draw the cumulative frequency curve i.e. less than ogive on a graph paper.
From graphs, write down the median salary (in Rs)?View SolutionThe daily wages of 80 workers in a project are given below.

Use a graph paper to draw an ogive for the above distribution. (Use a scale of 2 cm = Rs 50 on X-axis and 2 cm = 10 workers on Y-axis). Use your ogive to estimate :
the lower quartile wage of workers.View SolutionThe weight of 50 workers is given below :

Draw an ogive of the given distribution using a graph sheet. Take 2 cm = 10 kg on one axis and 2 cm = 5 workers along the other axis. Use a graph to estimate the following the upper and lower quartiles.View Solutionनिम्नांकित आंकड़े के लिए 'कम प्रकार 'का संचयी बारम्बारता वक्र खींचे और आलेख से माध्यक ज्ञात करे ।
 View Solution
से कम ' प्रकार के संचयी बारम्बारता ग्राफ में , संचयी बारम्बारता के साथ निम्न में से कौन - सी राशि को ग्राफ में लिया जाता है ?
View SolutionUse Graph paper for this question.
A survey regarding height ( in cm) of 60 boys belonging to Class 10 of a school was conducted. The following data was recorded.

Taking 2 cm = height of 10 cm along one axis and 2 cm = 10 boys along the other axis draw an ogive of the above distribution. Use the graph to estimate the following :
(i) the medianView SolutionUse Graph paper for this question.
A survey regarding height ( in cm) of 60 boys belonging to Class 10 of a school was conducted. The following data was recorded.
Taking 2 cm = height of 10 cm along one axis and 2 cm = 10 boys along the other axis draw an ogive of the above distribution. Use the graph to estimate the following :
(iii) if above 158 cm is considered as the tall boys of the class. Find the number of boys in the class who are tall.View Solutionवर्गीकृत आंकड़ों की 'से कम प्रकार' और 'से अधिक प्रकार' की संचयी बारम्बारता वक्रो के प्रतिच्छेद बिंदु के भुज से आंकड़ों का प्राप्त होता है
View Solutionवर्गीकृत आँकड़ों की 'से कम प्रकार' और 'से अधिक प्रकार' की संचयी बारम्बारता वक्रों के प्रतिच्छेद बिंदु के भुज से आँकड़ों को प्राप्त होना है :
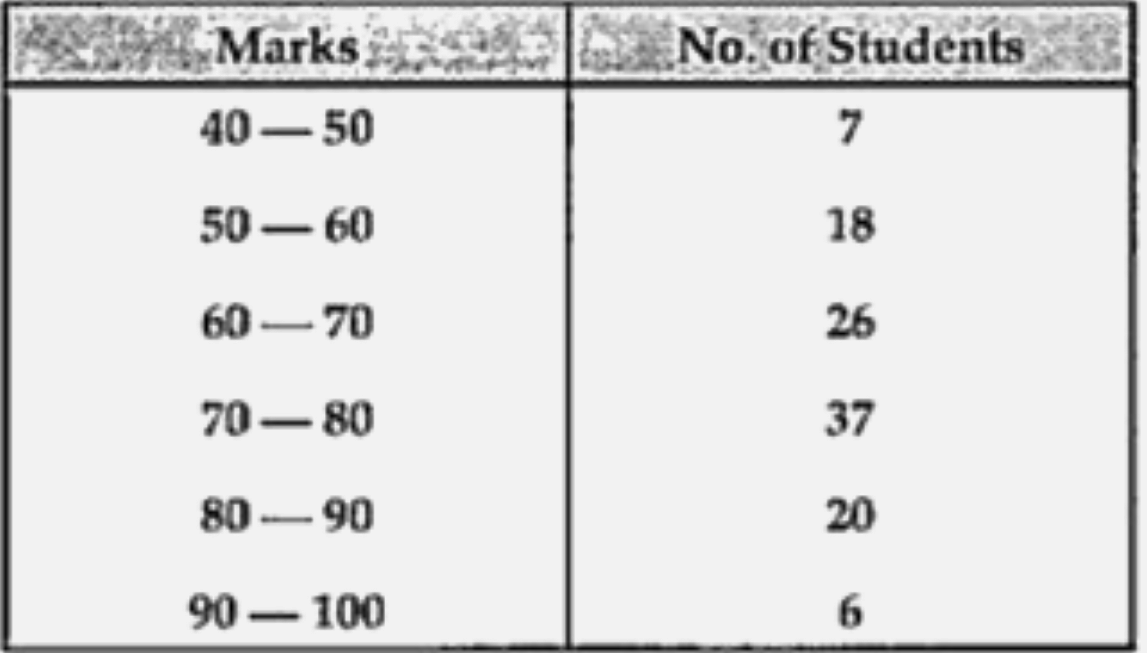
View SolutionThe marks obtained by 100 students in a Mathematics test are given below :

Draw an ogive for the given distribution on a graph sheet.
(Use a scale of 2 cm = 10 units on both axis).
Use the ogive to estimate the :
(ii) lower quartile.View SolutionThe following is the distribution of weights (in kg) of 40 persons.

Construct a cumulative frequency distribution (of the less than type) table for the data above.View SolutionThe following is the distribution of weights (in kg) of 40 persons.

Construct a cumulative frequency distribution (of the less than type) table for the data above.View SolutionUsing the data in example (3) above, prepare less than type cumulative frequency table and answer the following questions.
How many students obtained less than 10 marks ?View SolutionConstruct a frequency polygon for the following frequency distribution , using a graph sheet .

Use 2 cm = 10 Marks
2 cm = 5 Students [Specimen paper , 2019]View Solution
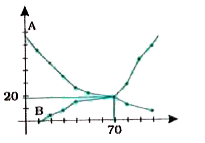
(i) Find the median of the data from the above graph.
(ii) State the type for curve A and curve B.View SolutionThe daily wages of 80 workers in a project are given below.

Use a graph paper to draw an ogive for the above distribution. (Use a scale of 2 cm = Rs 50 on X-axis and 2 cm = 10 workers on Y-axis). Use your ogive to estimate :
the median wage of the workers.View SolutionIn a less than cumulative frequency distribution, frequency and cumulative frequency of a class are 10 and 20 respectively, then the cumulative frequency of the previous class is ______.
View Solution
