The following table shows the distribution of salaries of a group of workers :

Determine cumulative frequencies
Draw the cumulative frequency curve i.e. less than ogive on a graph paper.
From graphs, write down the median salary (in Rs)?Solution in Punjabi
Step by step video & image solution for The following table shows the distribution of salaries of a group of workers : Determine cumulative frequencies Draw the cumulative frequency curve i.e. less than ogive on a graph paper. From graphs, write down the median salary (in Rs)? by Maths experts to help you in doubts & scoring excellent marks in Class 10 exams.
Updated on:21/07/2023Topper's Solved these Questions
Similar Questions
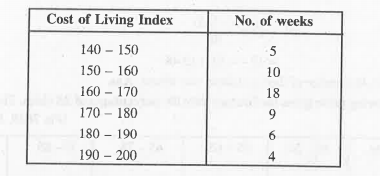
In a city, the following weekly observations were made in a study of cost of living index for the year 1980-81.
 Calculate the mean weekly cost of living index by a suitable method.
View SolutionAn aeroplane, when 3000 m high, passes vertically above another aeroplane at an instant when the angles of elevation of the two aeroplanes from the same point on the ground are 60∘ and 45∘ respectively. Find the vertical distance between the two aeroplanes.
View SolutionA toy is in the form of a cone mounted on a hemisphere of radius 3.5 cm. The total height of the toy is 15.5 cm. Find the surface area of the toy
View SolutionDetermine the point of symmetry of a regular hexagon.
View SolutionDraw the bisector of ∠AOB=58∘
ltimg src="https://d10lpgp6xz60nq.cloudfront.net/physics_images/PS_MATH_VII_C05_S01_009_Q01.png" width="80%"gt
View SolutionMatch the following Column A to Column B

View SolutionMatch the following Column A to Column B

View SolutionMatch the following Column A to Column B

View SolutionThe inequation represented by the graph given below is :
View SolutionThe inequation that best describes the graph given below is _________
View SolutionThe inequation that best describes the following graph is _________
View SolutionIn the given figure, PQRS is a parallelogram. A and B are the mid-point of ¯¯¯¯¯¯PQ and ¯¯¯¯¯SR respectively. If PS=BR, then the quadrilateral ADBC is a…………………… ,
ltimg src="https://d10lpgp6xz60nq.cloudfront.net/physics_images/PS_MATH_IX_C12_E05_020_Q01.png" width="80%"gt
View SolutionWhich of the following statement is not correc for following straight line graph :-
ltimg src="https://d10lpgp6xz60nq.cloudfront.net/physics_images/ALN_PHY_R04_E01_015_Q01.png" width="80%"gt
View SolutionMagnitude of slope i.e. steepness of graph shown in figure ltimg src="https://d10lpgp6xz60nq.cloudfront.net/physics_images/ALN_PHY_R04_E01_026_Q01.png" width="80%"gt
View SolutionFollowing is the age distribution of a group of students. Draw the cumulative frequency polygon, cumulative frequency curve (less than type) and hence obtain the median value.
View Solution
