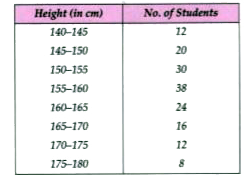
The following distribution represents the height of 160 students of a school.HeightcmNo. of students140-14512145-15020150-15530155-16038160-16524165-17016170-17512175-1808Draw on ogive for the given distribution taking 2 cm = 5 cm of height of one axis and 2 cm = 20 students on the other axis. Using the graph determine:i The median heightii The interquartile rangeiii The number of students whose height is above 172 cm.
Taking height of student along x - axis and cumulative frequency along y - axis we will draw an ogive.iThrough mark for 80 draw a parallel line to x - axis which meets the curve; then from the curve draw a vertical line which meets the x - axis at the mark of 157.5.iii Through mark for 172 on x - axis draw a vertical line which meets the curve; then from the curve draw a horizontal line which meets the y - axis at the mark of 145.The number of students whose height is above 172 cm = 160 -144 = 16
Related Solutions
The following distribution represents the height of 160 students of a school.

Draw an ogive for the given distribution taking 2 cm = 5 cm of height on one axis and 2 cm = 20 cm students on the other axis. Using the graph, determine.
(i) The median height.
View SolutionThe following table shows the distribution of the heights of a group of students:

Use a graph sheet to draw an Ogive for the distribution. Use the Ogive to find:
the number of students whose height is more than 168 cm
View SolutionThe following table shows the distribution of the heights of a group of students:

Use a graph sheet to draw an Ogive for the distribution. Use the Ogive to find:
the number of students whose height is less than 148 cm.
View SolutionThe following data give the distribution of heights of students :
The median of the distribution is
View SolutionThe following data gives the distribution of height of students :
The median of the distribution is
View SolutionThe following data give the distribution of heights of students :
The median of the distribution is
View SolutionThe following data give the distribution of heights of students :
The median of the distribution is
View SolutionThe following data gives the distribution of height of students :
The median of the distribution is
View SolutionThe following data give the distribution of heights of students :
The median of the distribution is
View SolutionMarks obtained by 200 students in an examination are given below :

Draw an ogive for the given distribution taking 2 cm = 10 marks on one axis and 2 cm = 20 students on the other axis. Using the graph, determine :
(ii) The number of students who failed if minimum marks required to pass is 40.
View SolutionThe heights (in cm) of 35 students of a class are given below :
Find the median height.
View SolutionMarks obtained by 200 students in an examination are given below :

Draw an ogive for the given distribution taking 2 cm = 10 marks on one axis and 2 cm = 20 students on the other axis. Using the graph, determine :
(i) The median marks
View SolutionThe heights of students are given in cm as 161, 190, 185, 163, 172, 180, 162. The median height of the student is:
View SolutionThe heights (in cm) of students in a group are given below: What is the median height of students ?
View SolutionThere are 20 students in a class of them, the height of ten students is 150 cm each, the height of 6 students is 142 cm each and the height of 4 students is 132 cm each. Find the average height of all the students.
View SolutionThe marks obtained by 100 students in a Mathematics test are given below :

Draw an ogive for the given distribution on a graph sheet.
(Use a scale of 2 cm = 10 units on both axis).
Use the ogive to estimate the :
(i) median.
View Solutionविद्यार्थियों की ऊंचाई सेमी में इस प्रकार है:
उनकी माध्यिका ऊंचाई ज्ञात कीजिए।
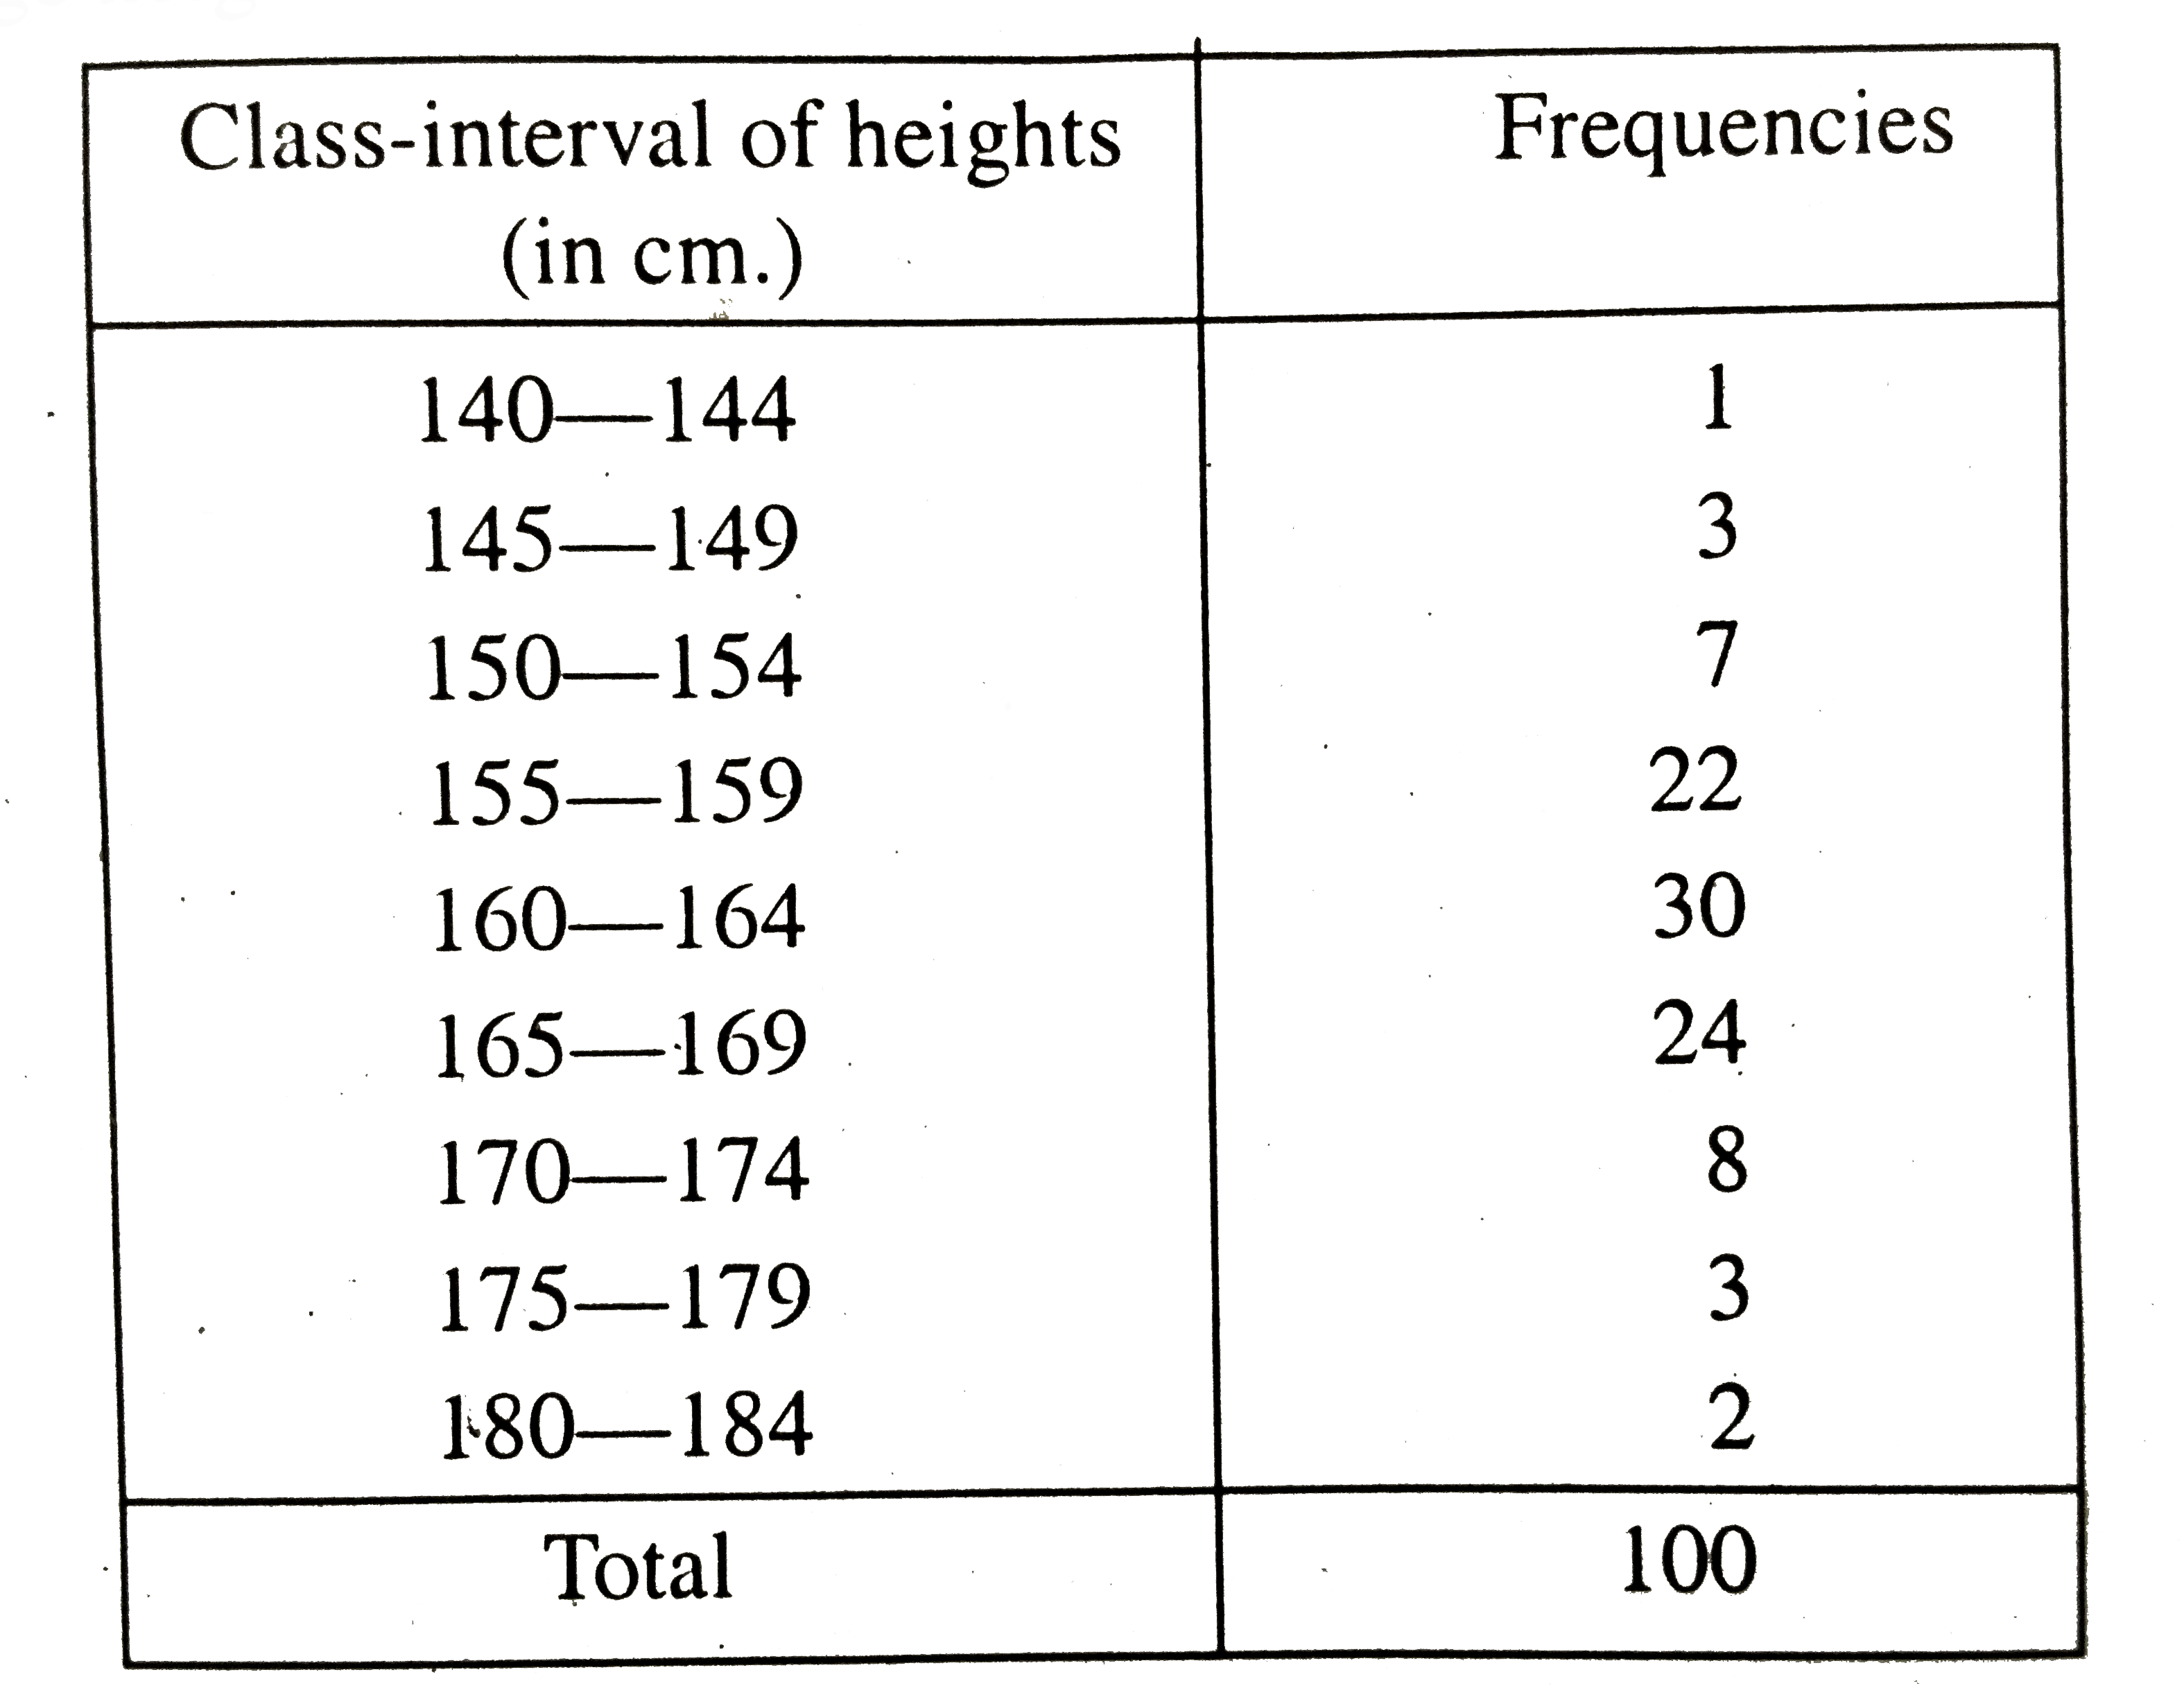
View SolutionThe frequency distribution of the heights (in cm) of 100 students of class X in a school .Find the average height of the students .

View SolutionThe mean height of 11 students in a group is 150 cm. The heights of the students are 154 cm, 145 cm, Y cm, Y + 4 cm, 160 cm, 151 cm, 149 cm, 149 cm, 150 cm, 144 cm and 140 cm. Find the value of Y and the heights of two students?
View Solution