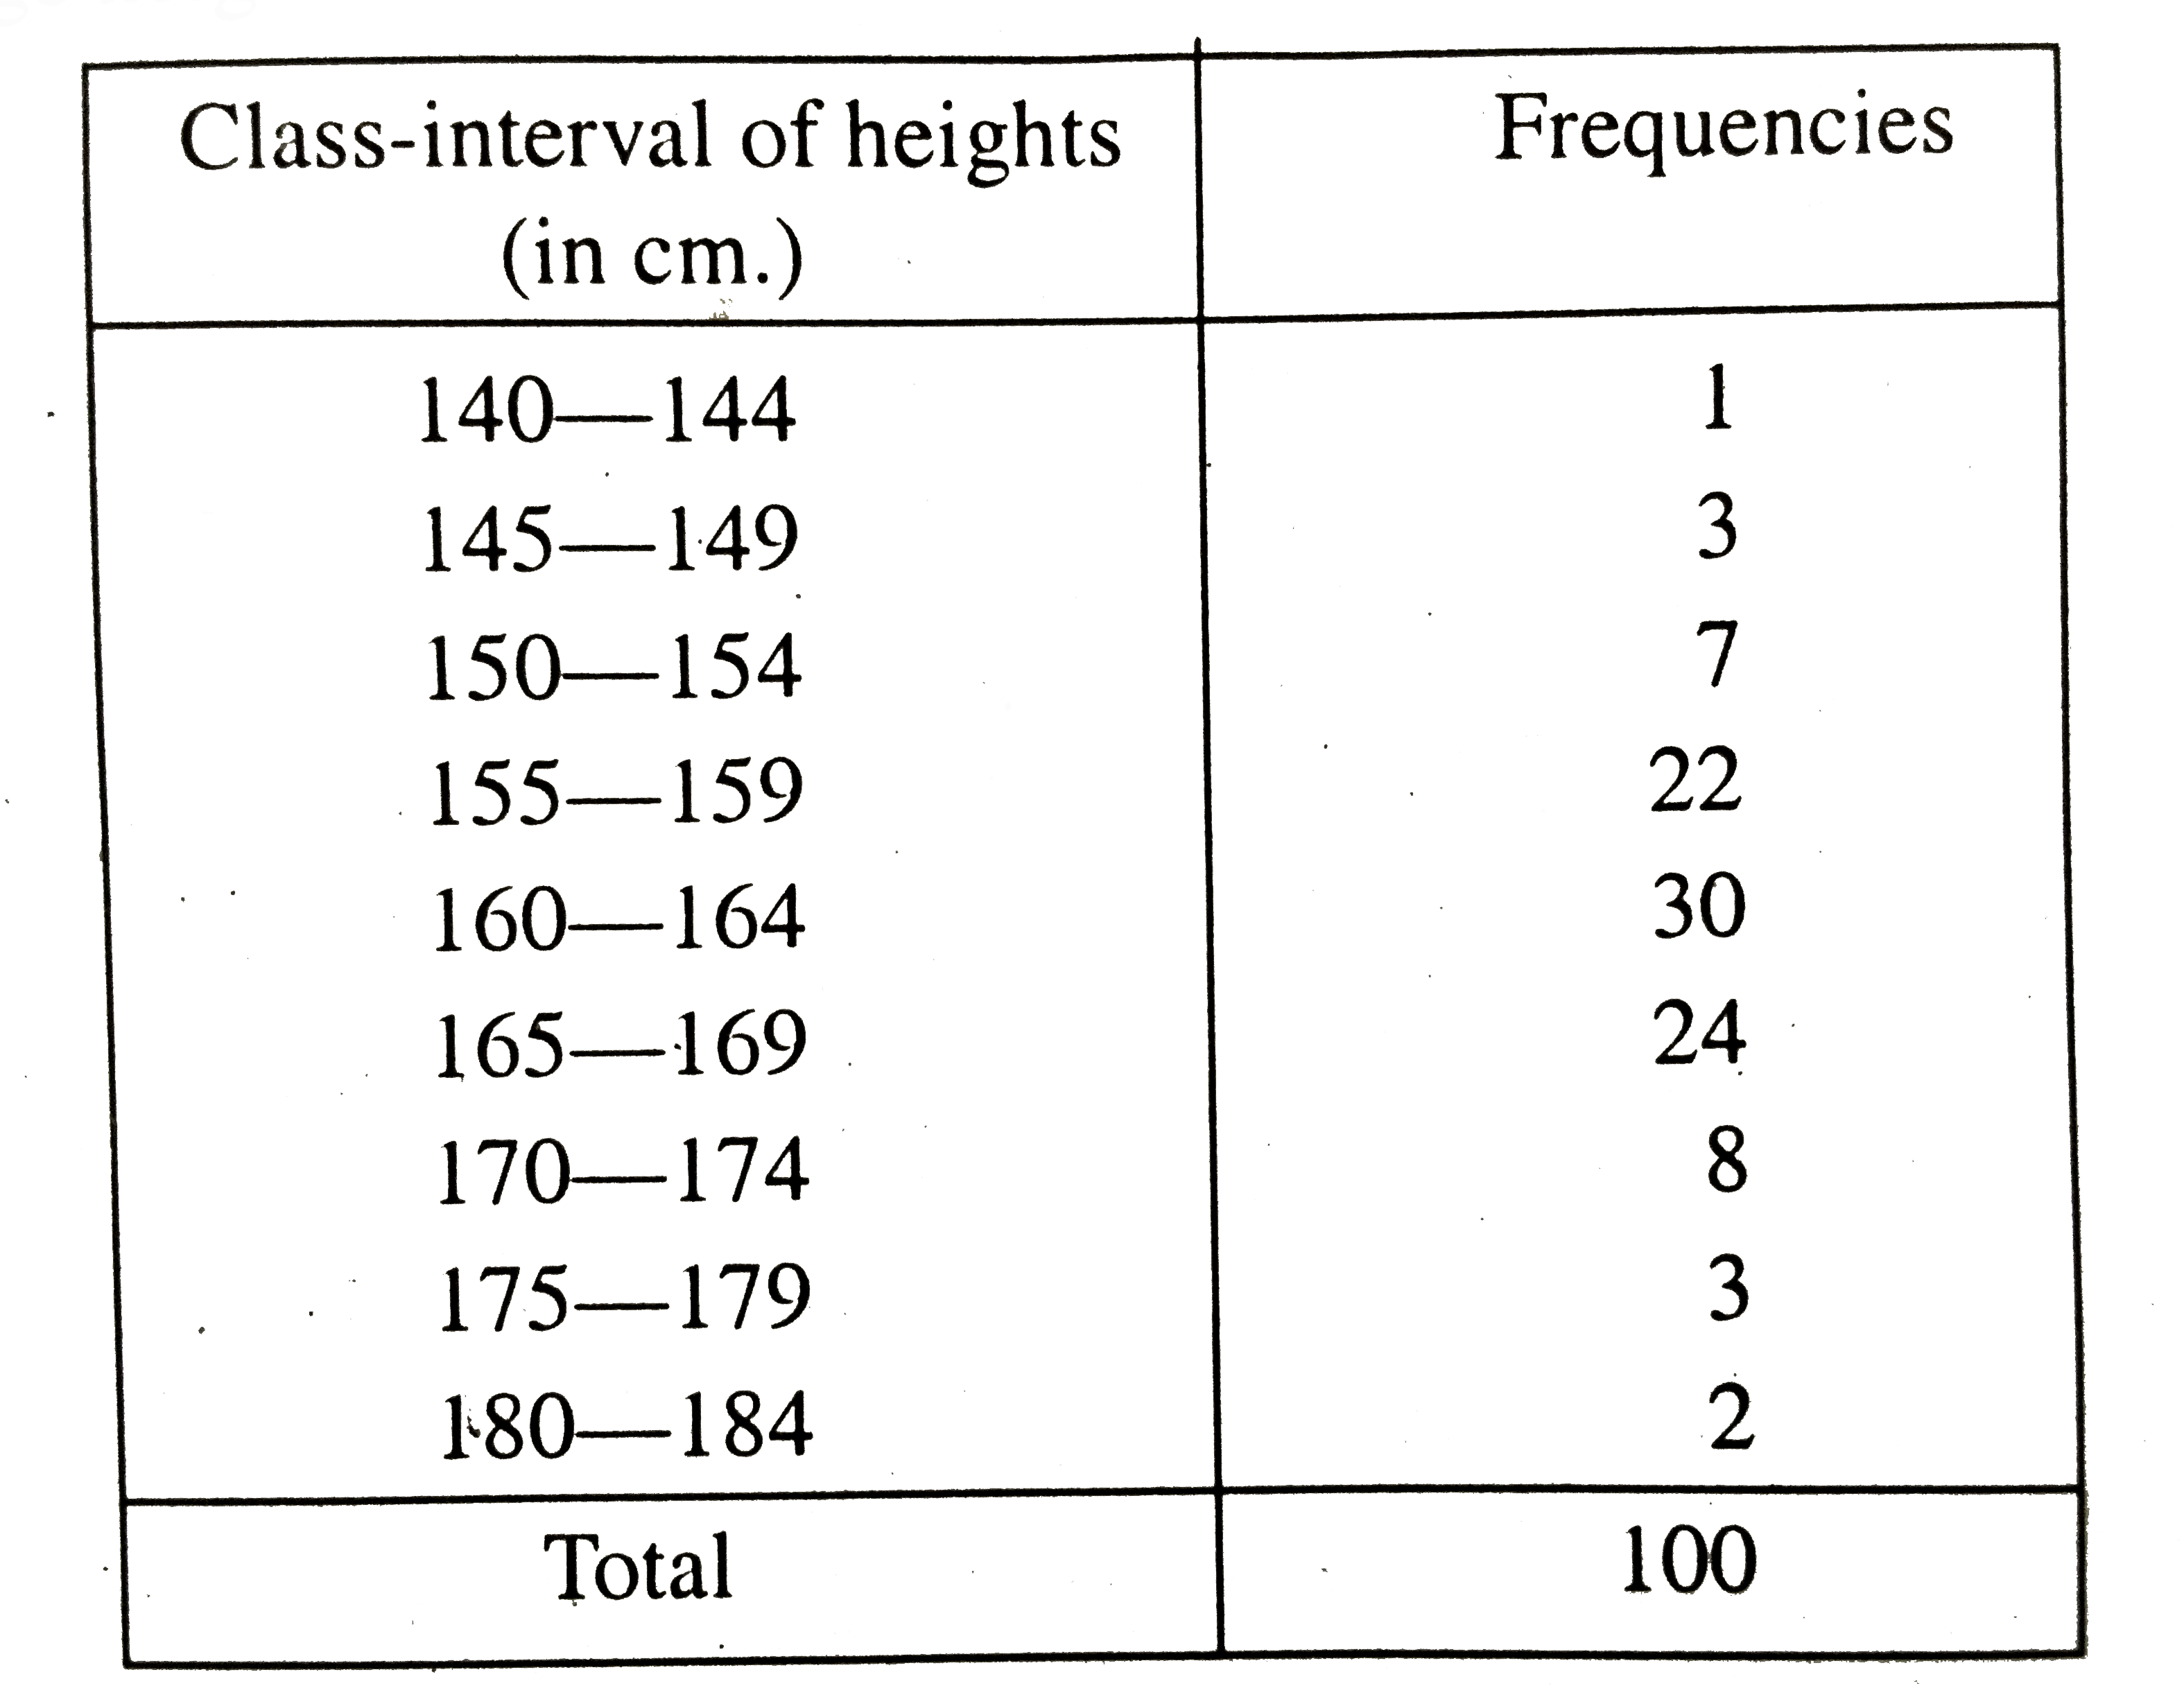
The frequency distribution of the heights (in cm) of 100 students of class X in a school .Find the average height of the students .
 Solution in Bengali
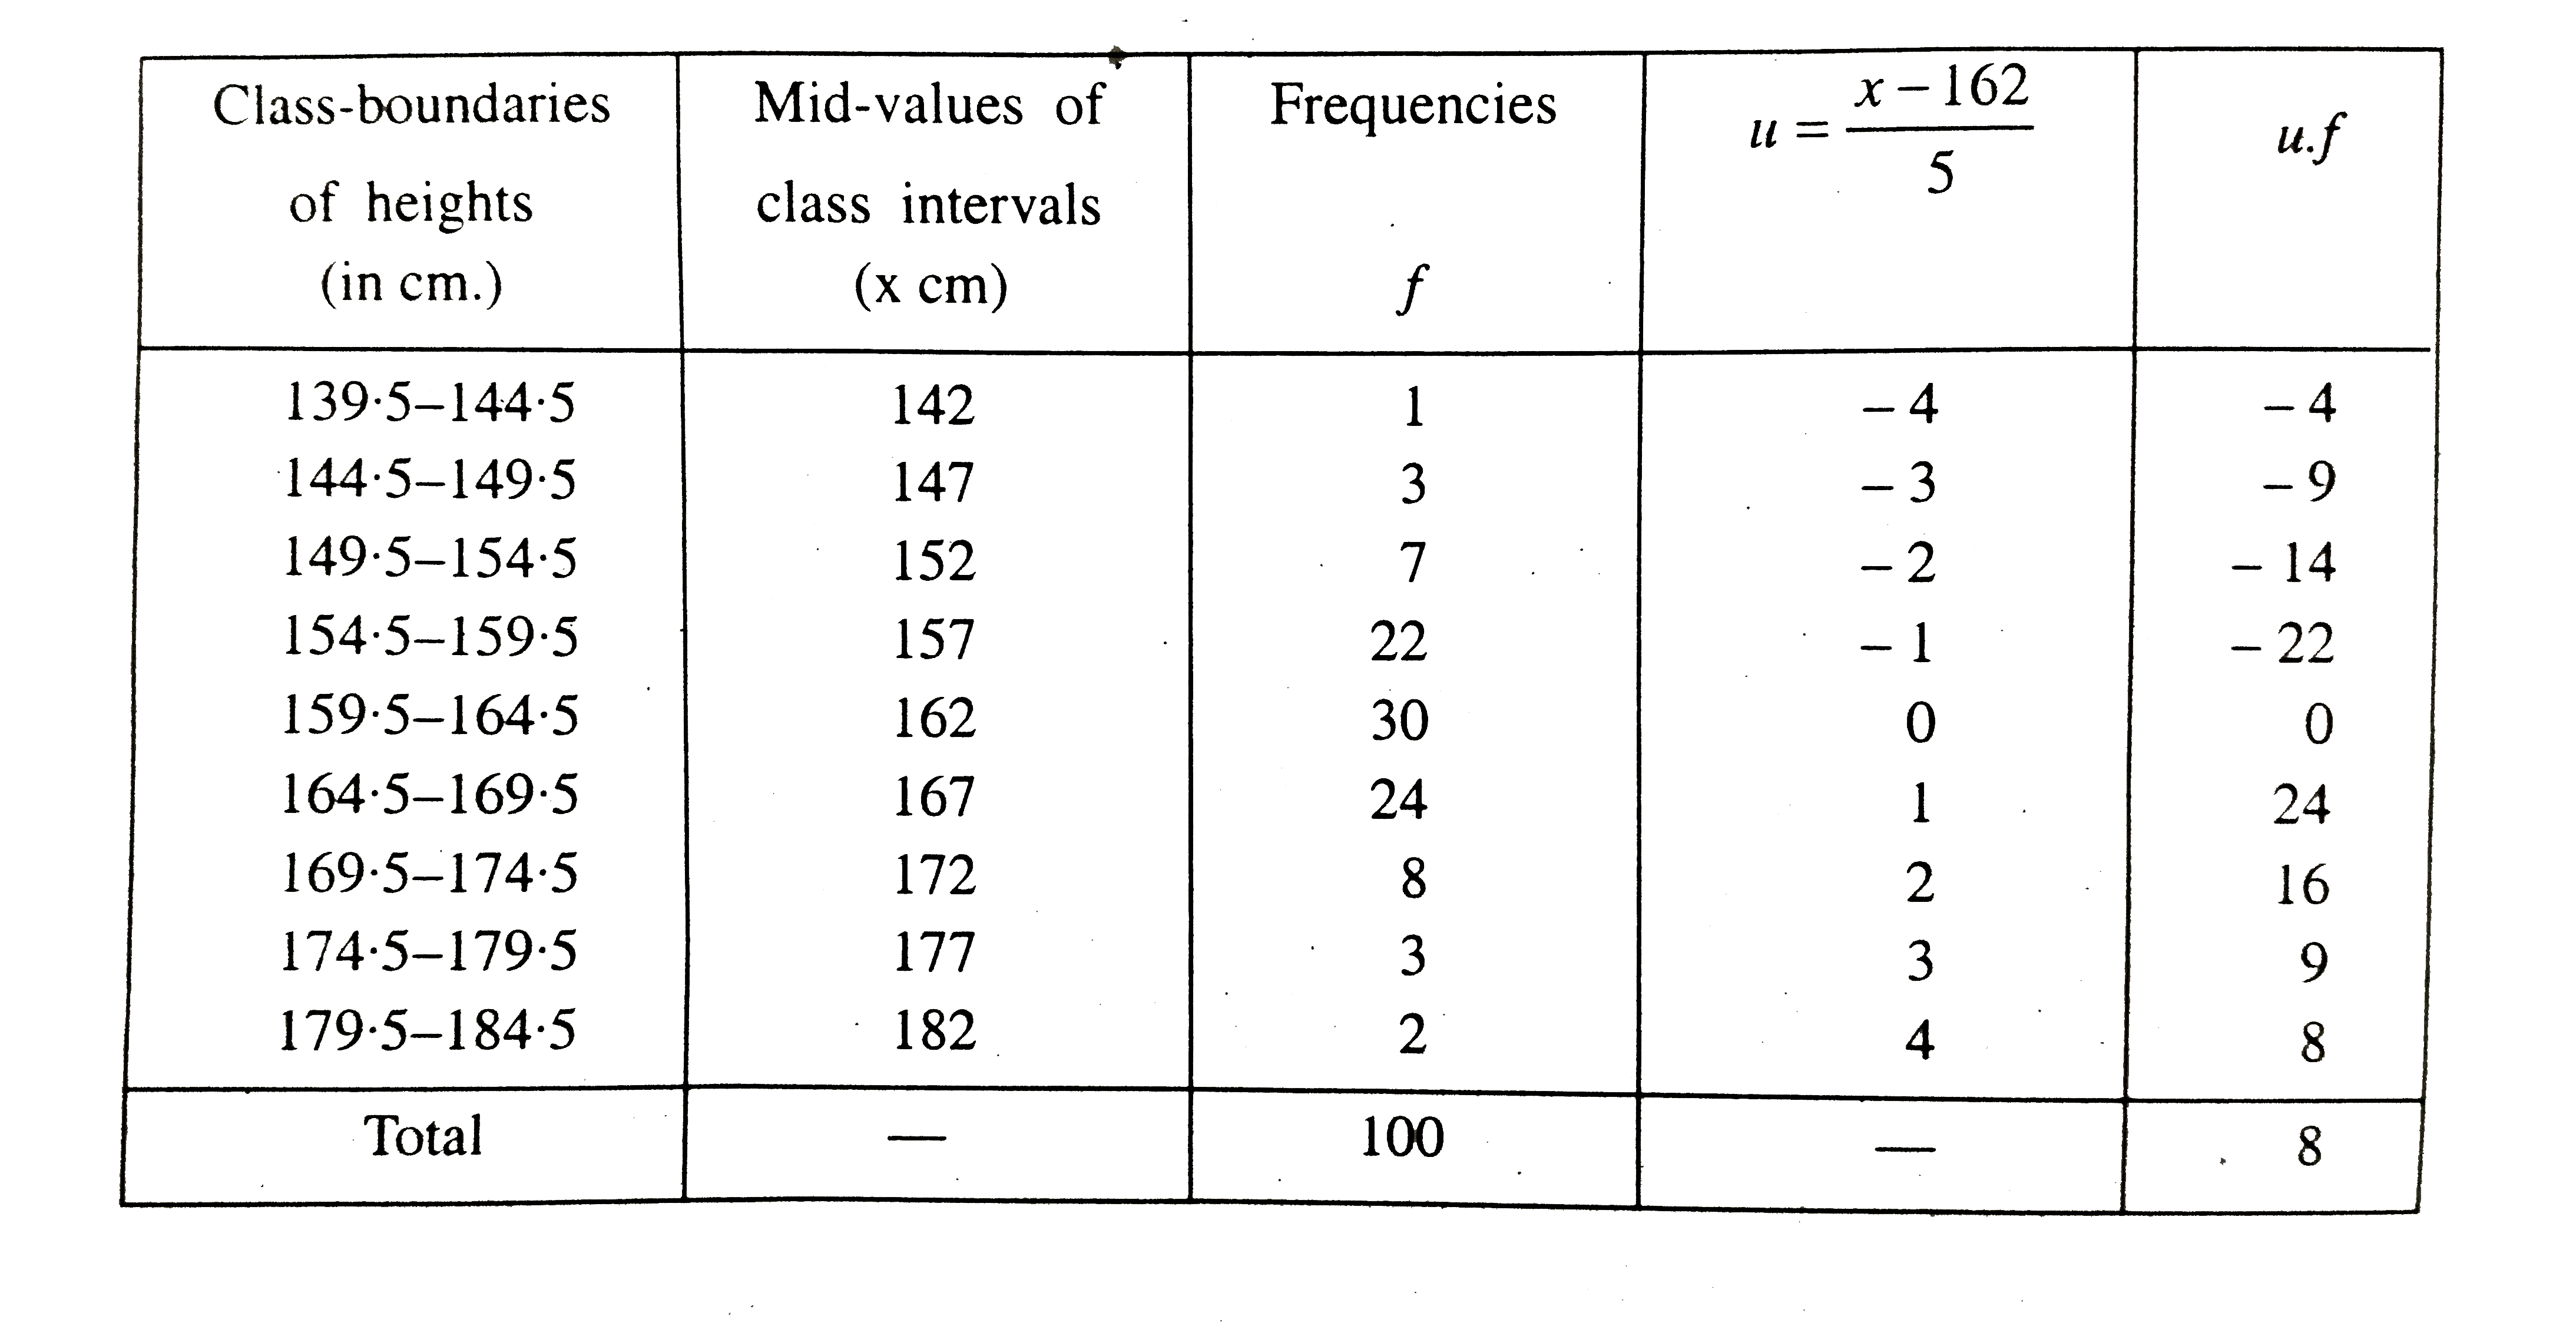
Here , the class boundaries are 139.5-144.5,149.5,……179.5-184.5. The class mid-values are 142,147,………182 and class-length=5. The mid value 162 of the class interval 160-164 is assumed to be the origin and 5, the class-length is assumed to be the unit, then u=x−1625and¯x=162+5¯u
Let us now prepare the following table :

∴u=∑m.f∑f=8100=0.08
∴¯x=162+5.¯u=162+5×0.08=162+0.40=162.40cm .
∴ The average height of 100 students is 162.4 cm.
Topper's Solved these Questions
- MEASURES OF CENTRAL TENDENCYBOOK - CALCUTTA BOOK HOUSECHAPTER - MEASURES OF CENTRAL TENDENCYEXERCISE - EXERCISE
36 Videos
- CONSTRUCTION: CONSTRUCTION OF TANGENT TO A CIRCLEBOOK - CALCUTTA BOOK HOUSECHAPTER - CONSTRUCTION: CONSTRUCTION OF TANGENT TO A CIRCLEEXERCISE - Exercise-8.2
5 Videos
- MEDIAN AND MODEBOOK - CALCUTTA BOOK HOUSECHAPTER - MEDIAN AND MODEEXERCISE - EXERCISE
20 Videos
Similar Questions
How arithmetic mean is changed when the values of the variable are added or subtracted by a constant number ?
View SolutionConstruct two cricles of radii 4.2 cm and 2.8 cm , the distance between whose centres is 10 cm . Draw a direct common tangent to these two circles .
View SolutionWhat are the measure of central tendency. Define them.
View SolutionDetermine the point of symmetry of a regular hexagon.
View SolutionDtermine the images of the following figure about the given line :
View SolutionMatch the following Column A to Column B

View SolutionMatch the following Column A to Column B

View SolutionMatch the following Column A to Column B

View SolutionFind the area of figure given below.

View SolutionFind the perimeter of the figure given below.

View SolutionFind the area of the figure given below.

View SolutionThe inequation represented by the graph given below is :
View SolutionThe inequation that best describes the graph given below is _________
View SolutionThe inequation that best describes the following graph is _________
View SolutionIn Fig, find the value of x.
ltimg src="https://d10lpgp6xz60nq.cloudfront.net/physics_images/PS_MATH_IX_C12_S01_032_Q01.png" width="80%"gt
View Solution
