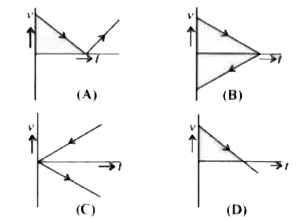
Three speed-time graphs are given below :Which graph represents the case of: i a cricket ball thrown vertically upwards and returning to the hands of the thrower ? ii a trolley decelerating to a constant speed and then accelerating uniformly ?
i Graph c: The speedof the ball goes on decreasing uniformly as it moves upwardzero at the highest point and then increases uniformly as it moves downward.ii Grapa: The speed of the trolley decreases uniformly then it moves at a constant speed and then the speed increases uniformly.
Related Solutions
Three speed-time graphs are given below : Which graph represents the case of : (i) A cricket ball thrown vertically upwards and returning to the hands of the thrower ? (ii) A trolley decelarating to a constant speed and then accelerating uniformly ?
View SolutionThree speed-time graphs are shown below.
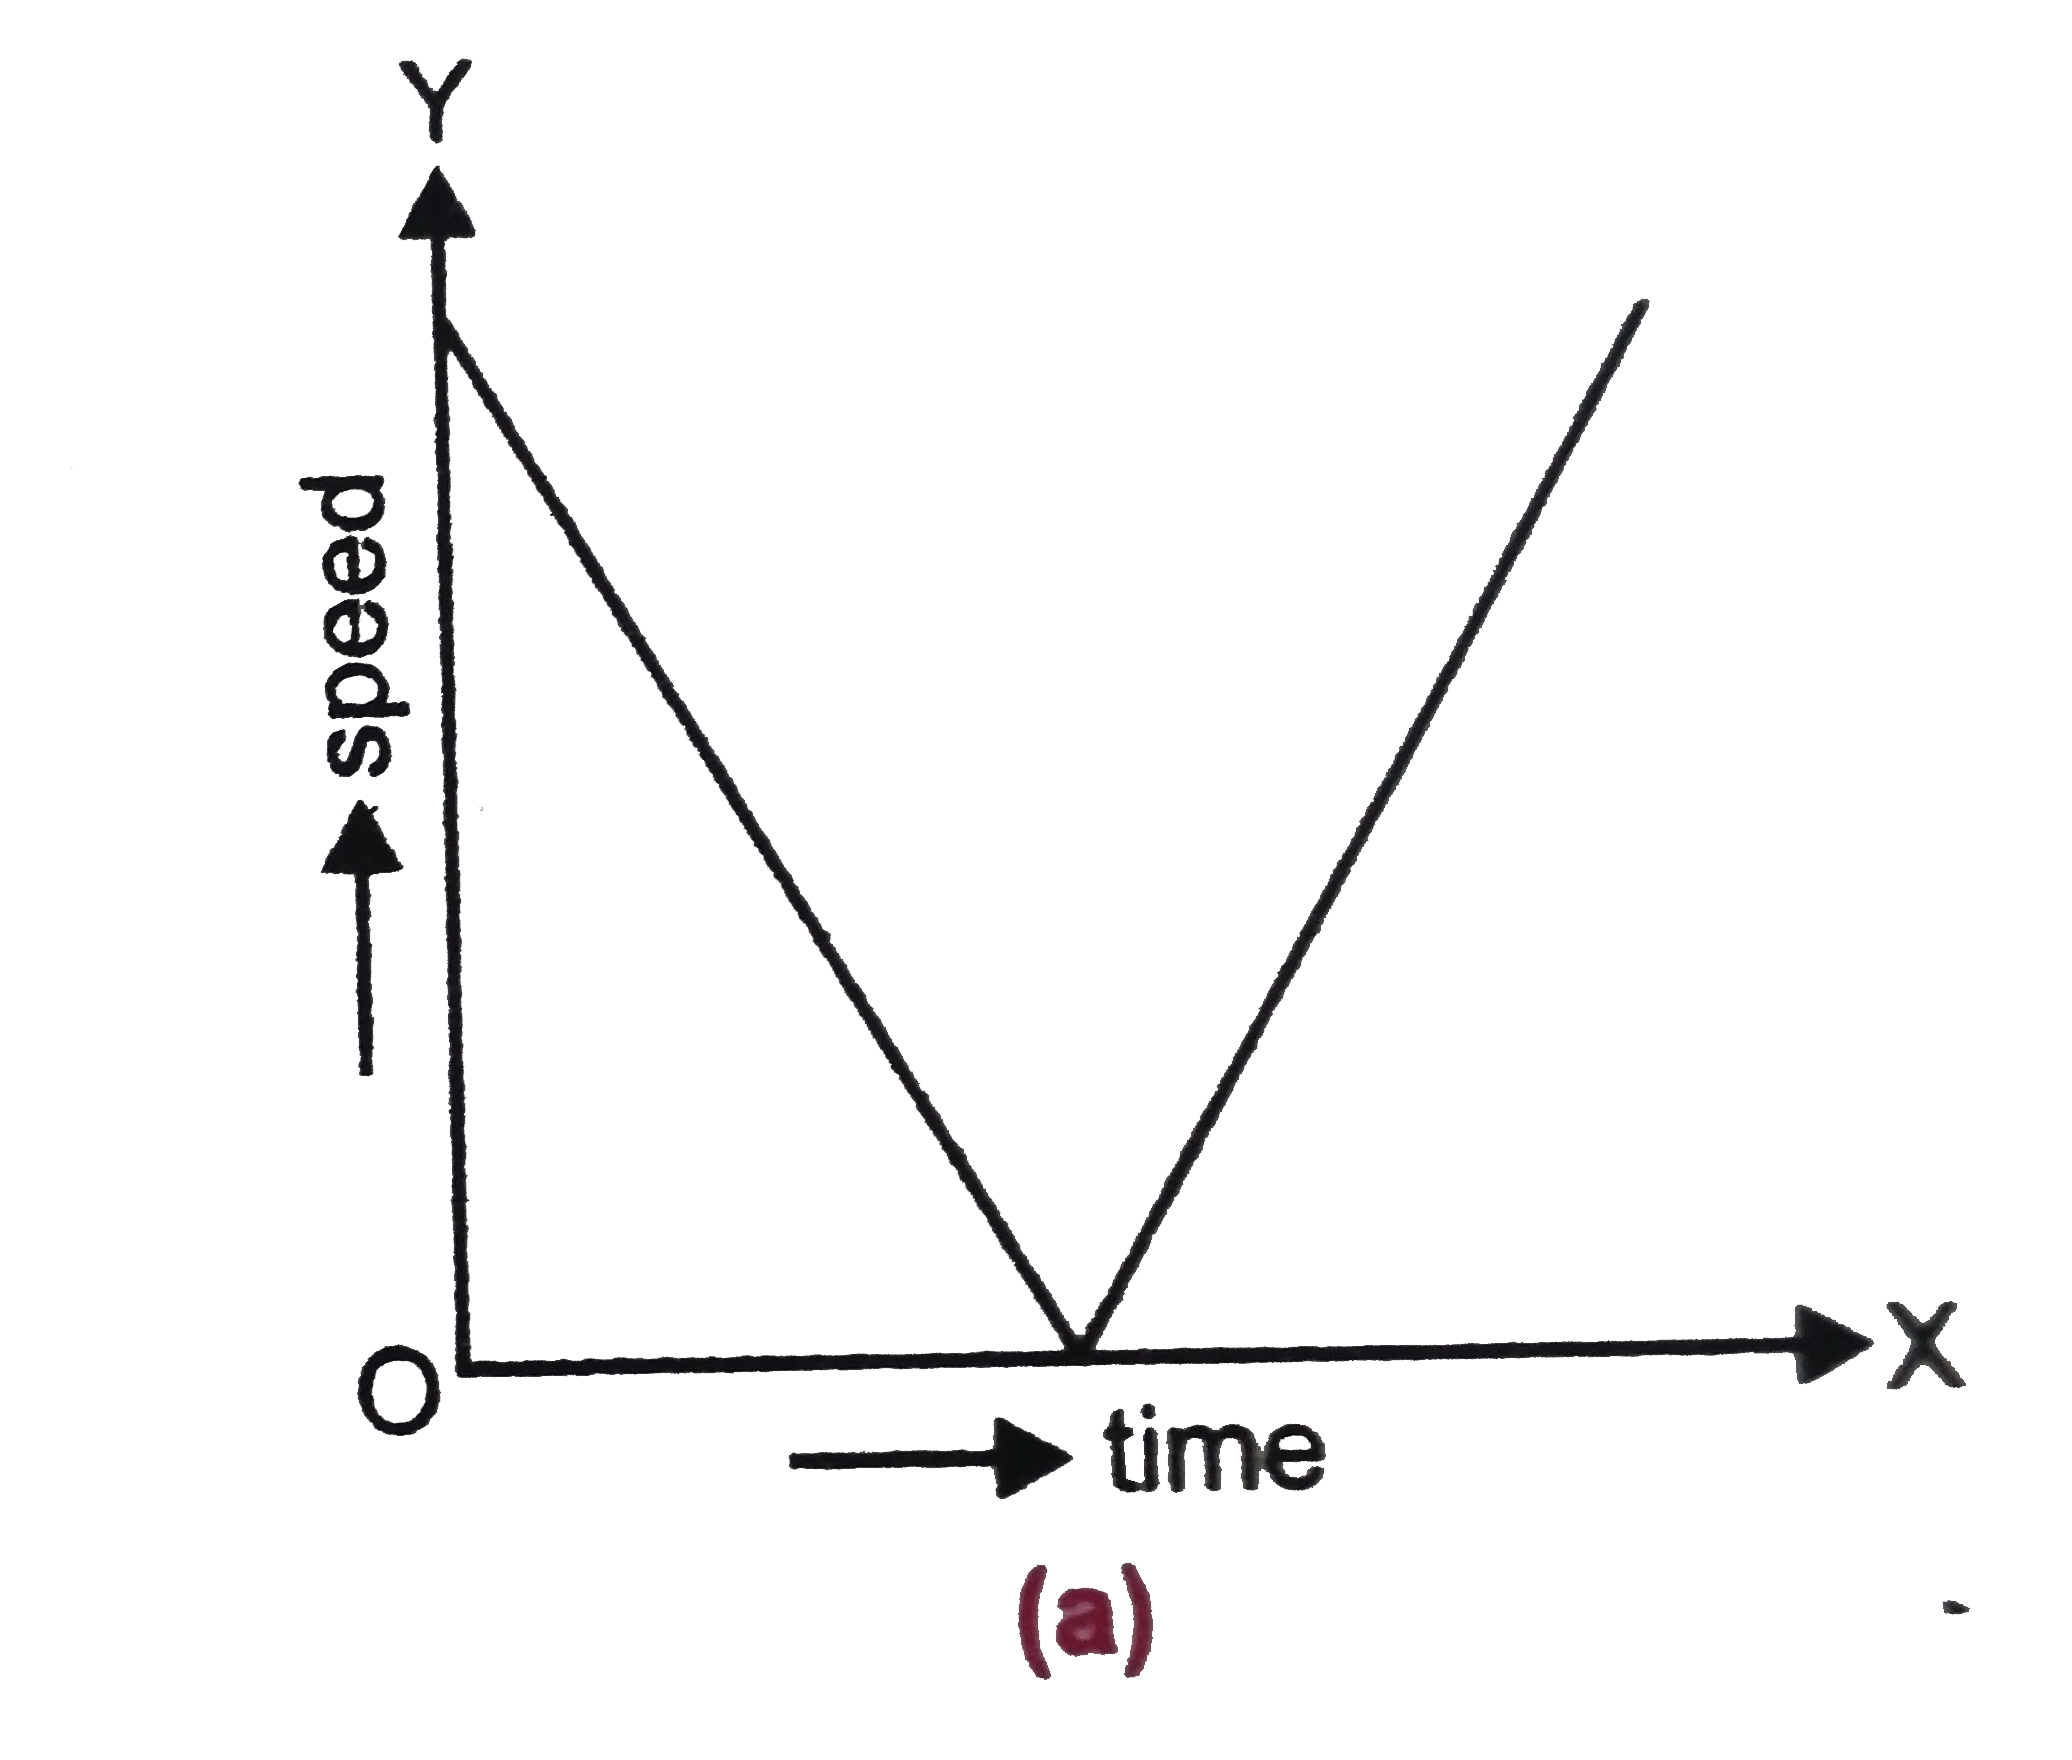
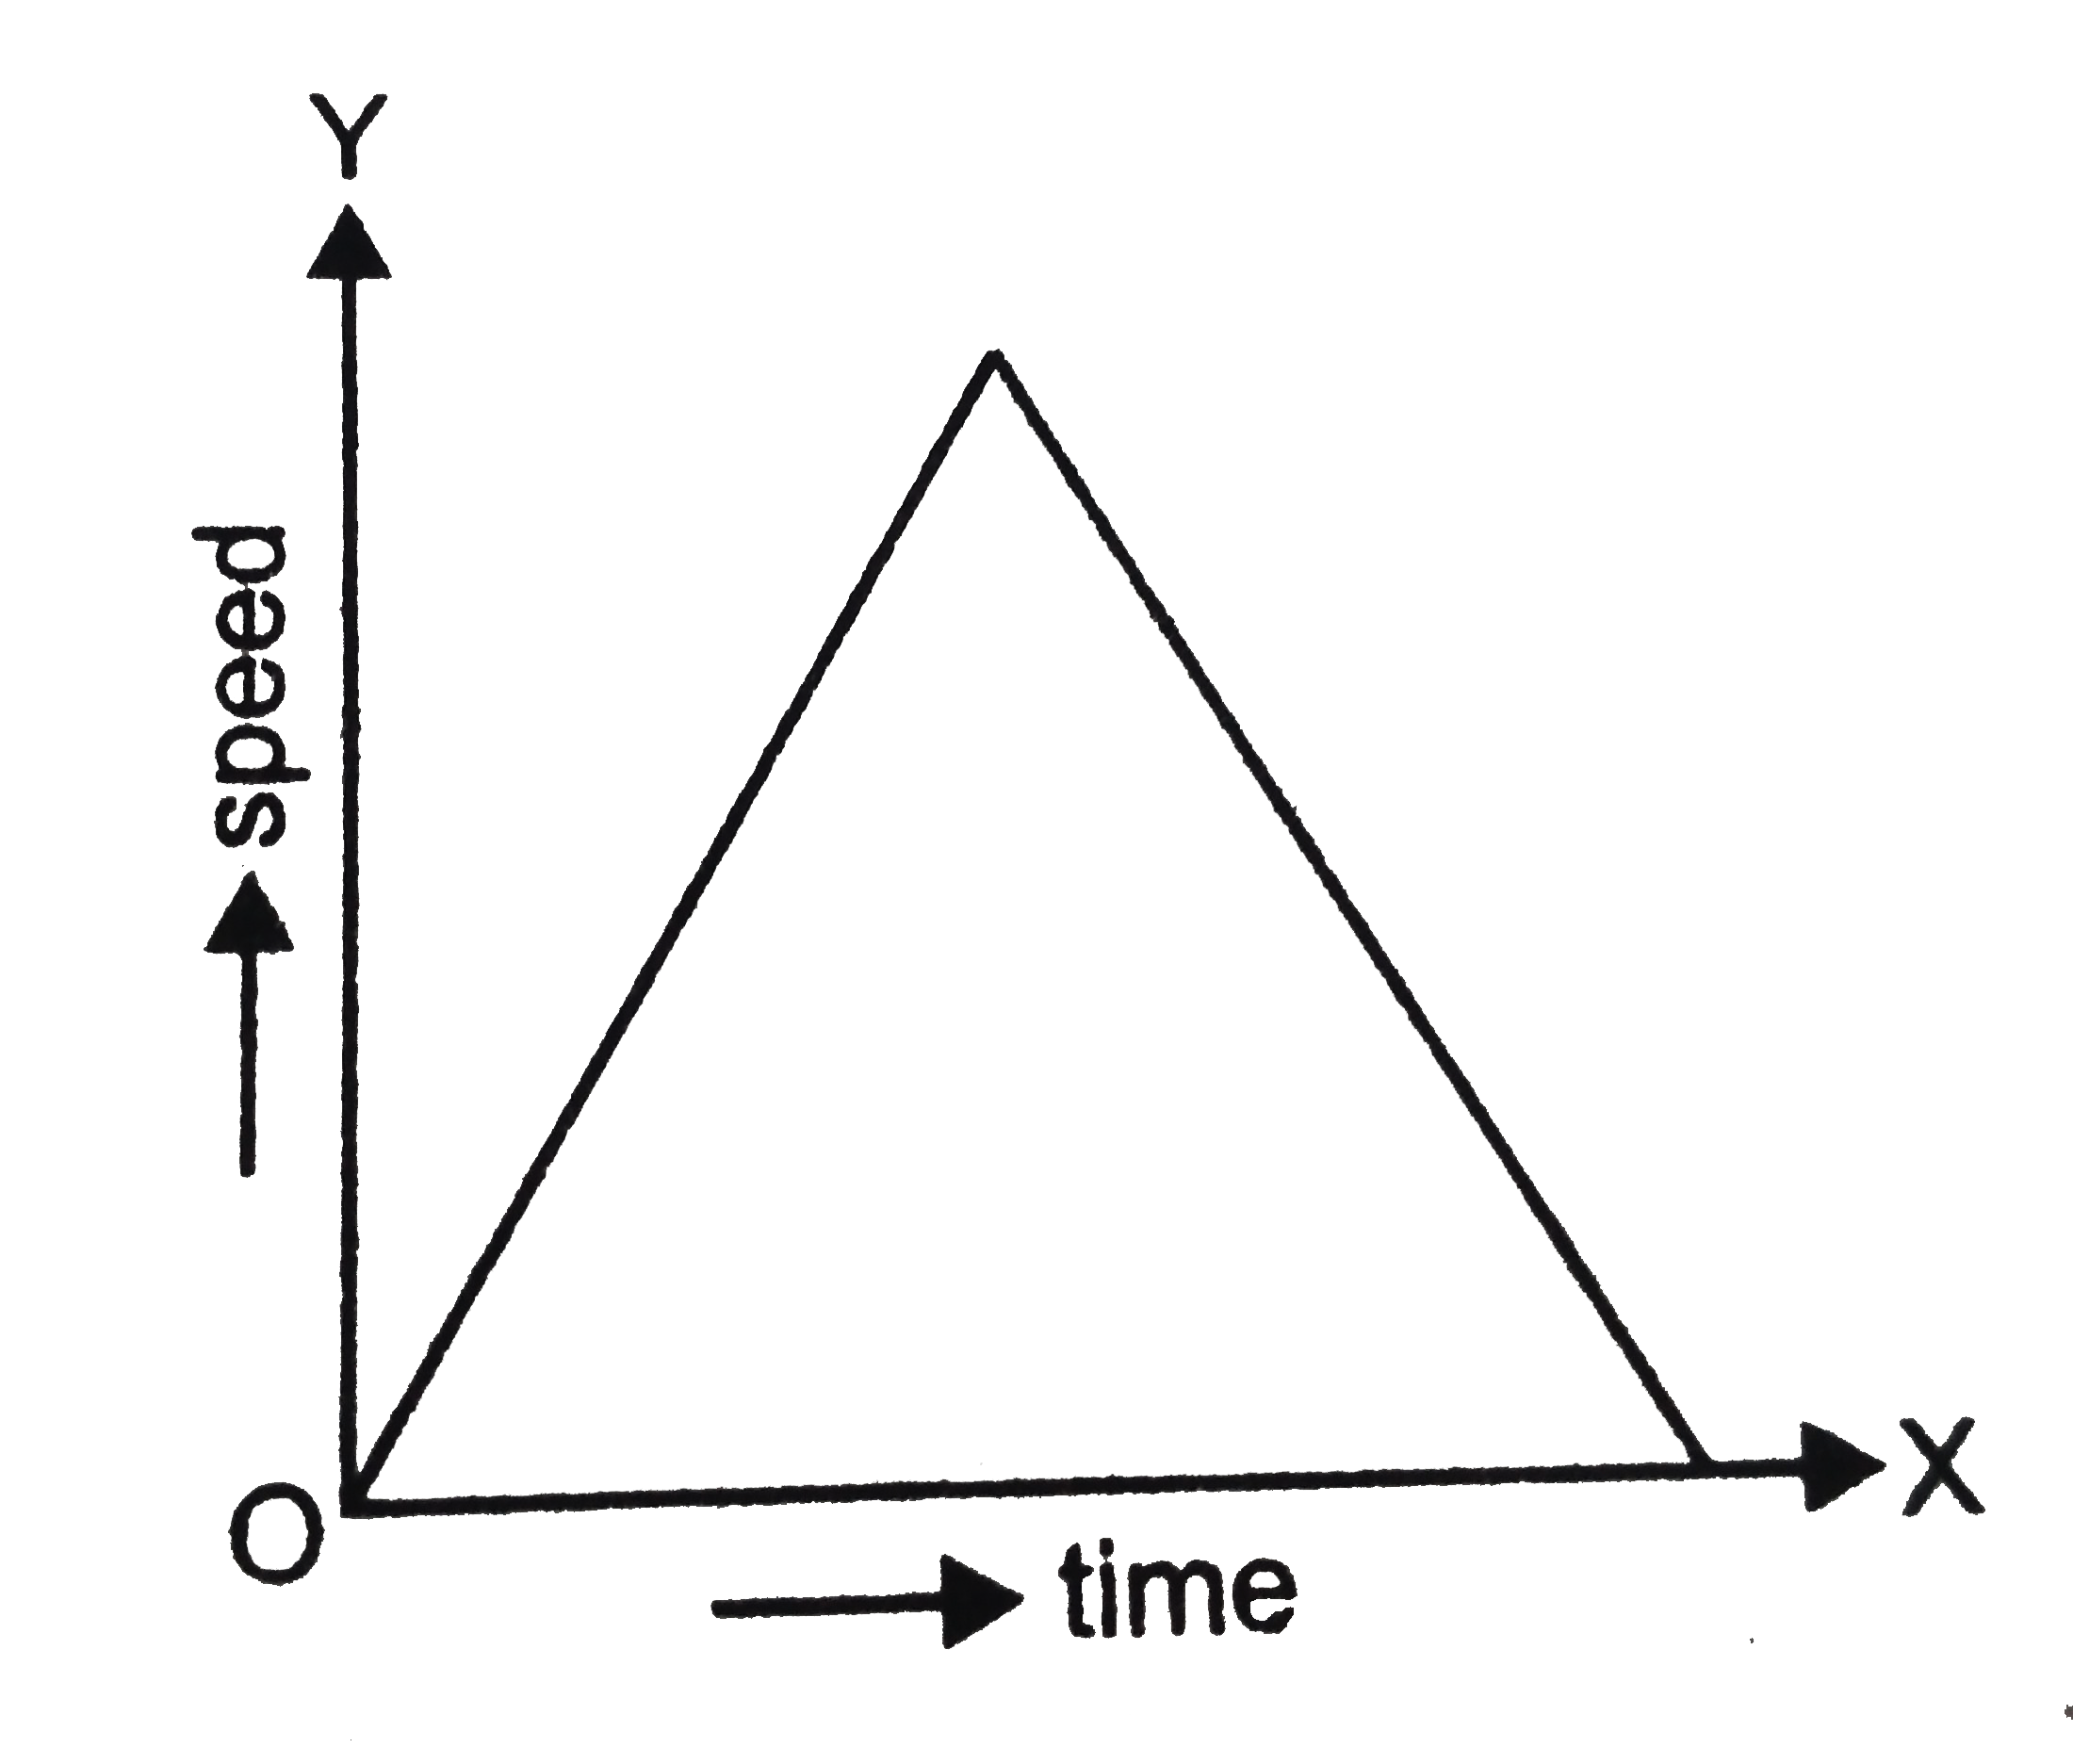
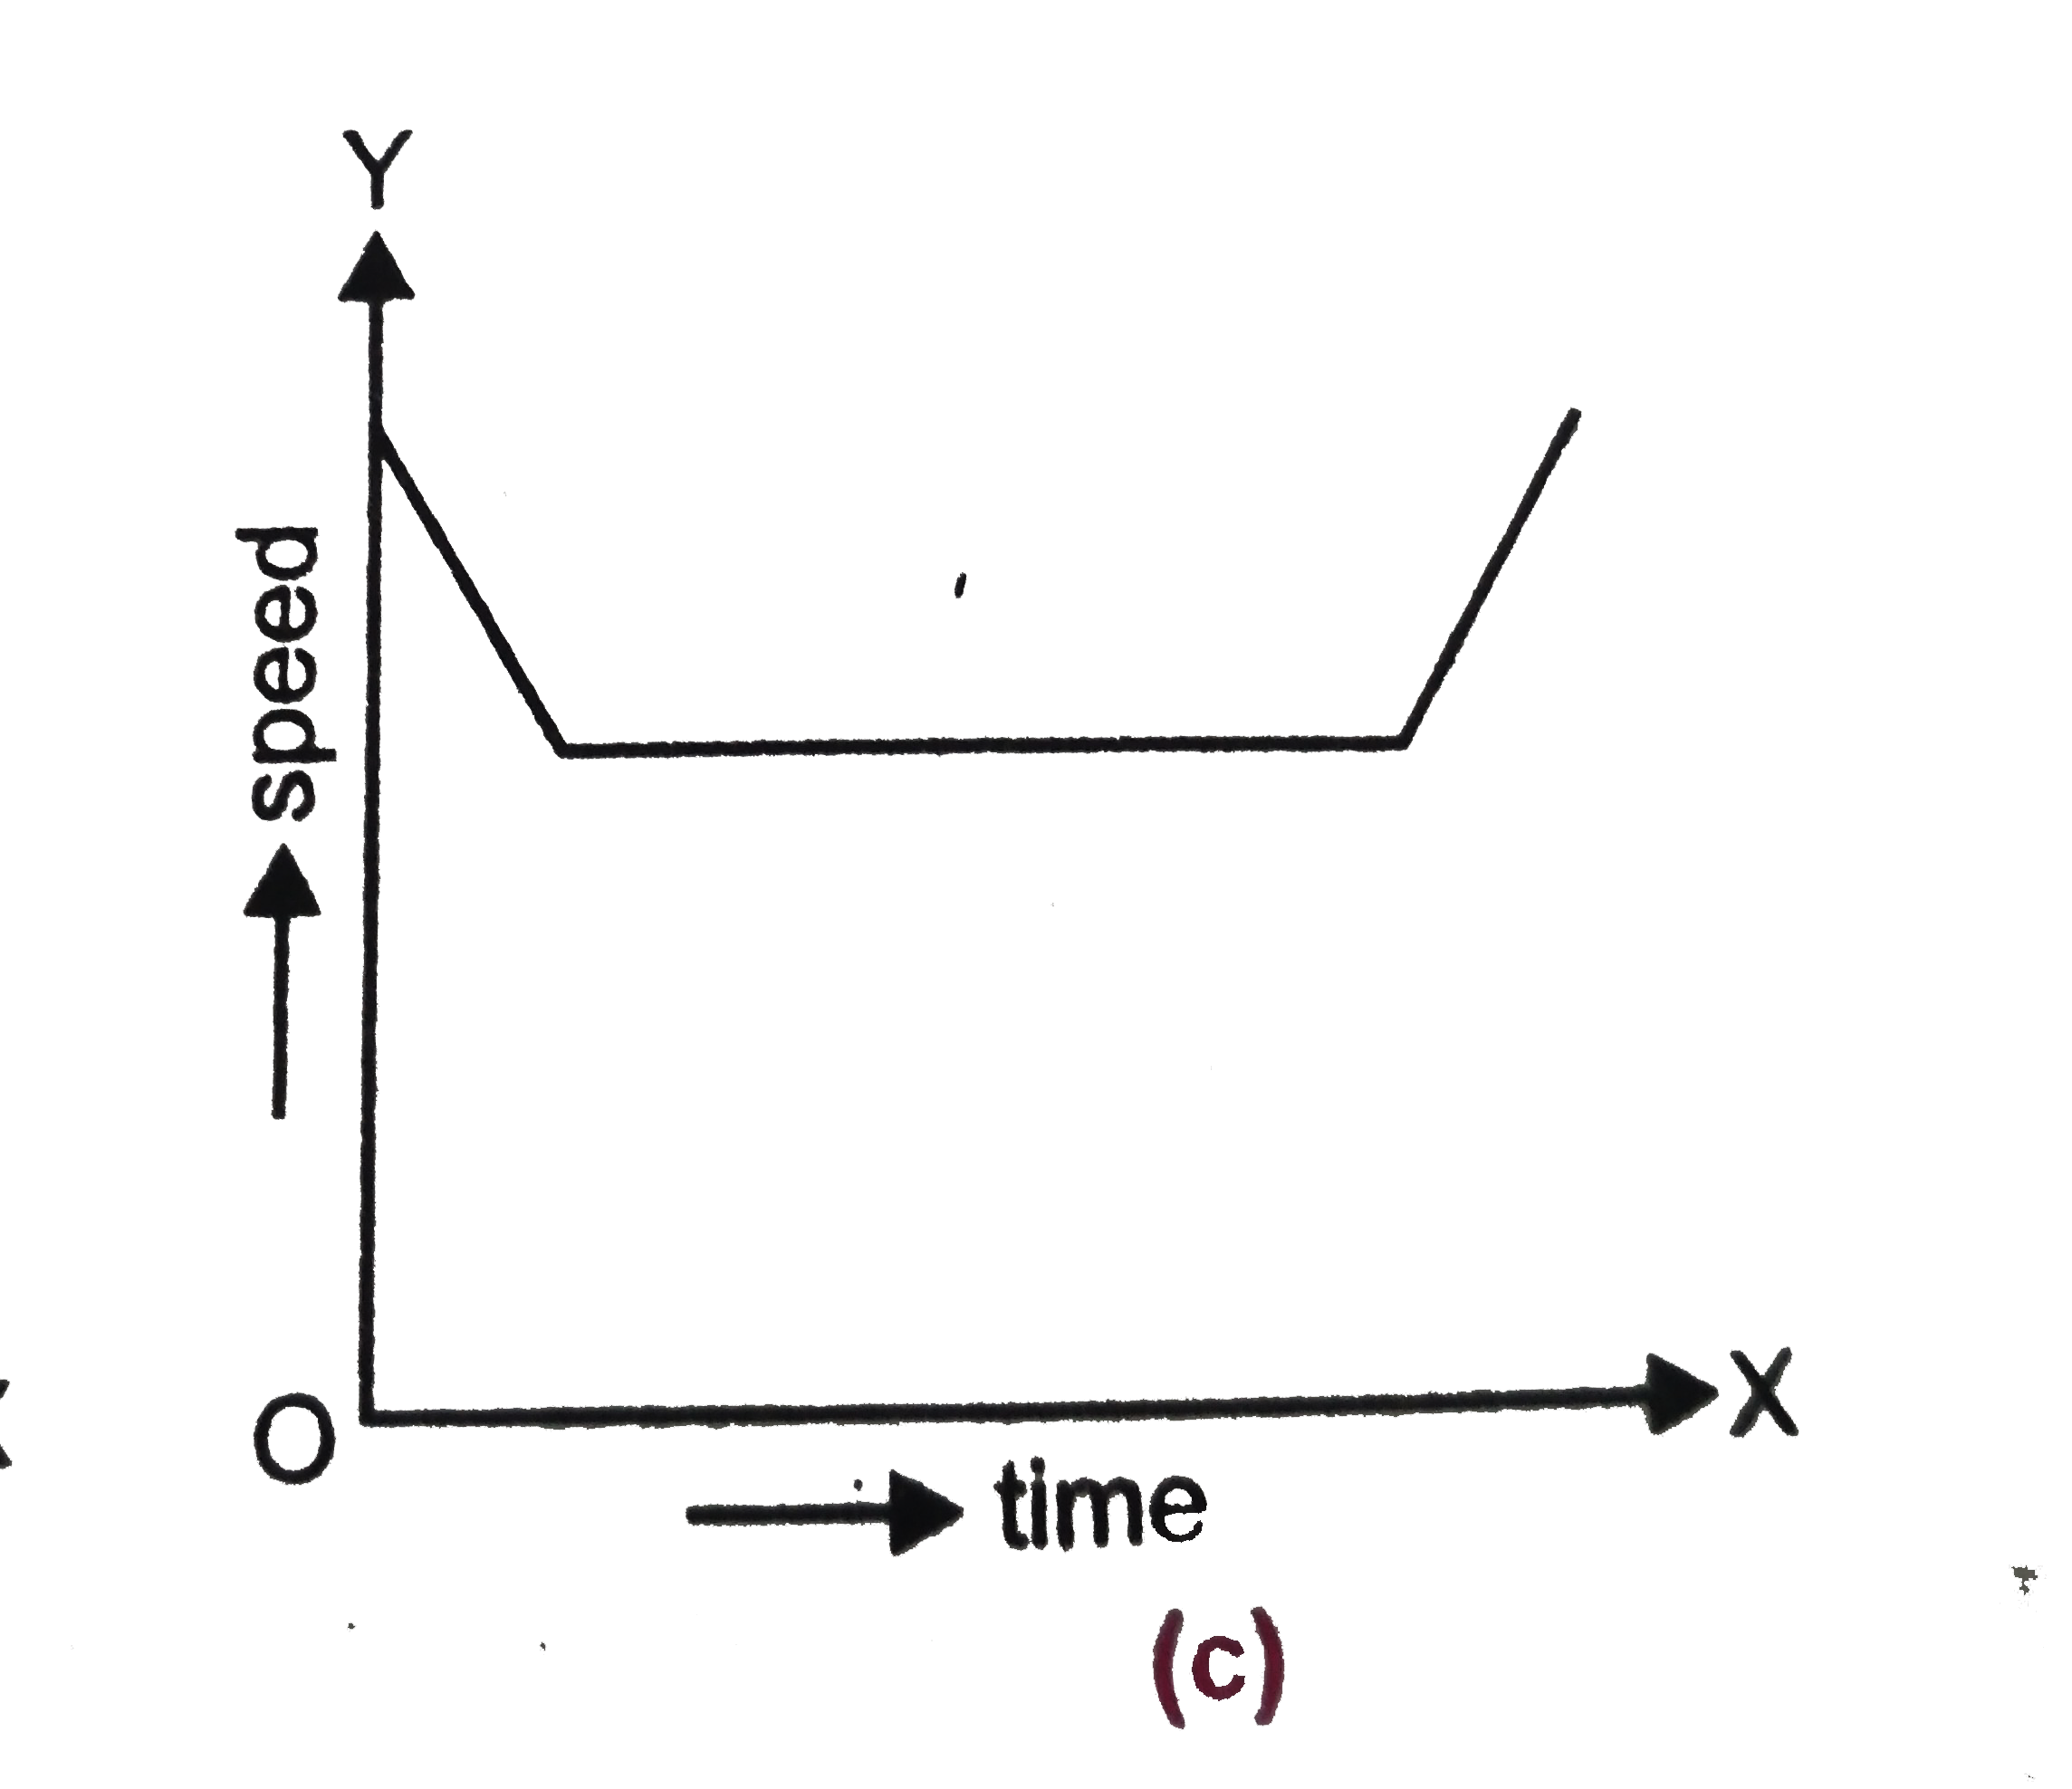
(i) A ball thrown vertically upwards and returning to the hand of the thrower ?
(ii) A body decelerating to a constant speed and accelerating.
View SolutionA ball is thrown vertically upward. Draw its (i) velocity -time graph (ii) acceleration -time graph.
View SolutionA ball is thrown vertically upward. For the motion of the ball till it returns to ground, draw the:- acceleration vs time graph.
View SolutionA ball is thrown vertically upwards. Which of the following plots represents the speed-time graph of the ball during its flight in the air (resistance of air is not ignored)?
View SolutionA ball is thrown vertically upwards. Which of the following plots represents the speed-time graph of the ball during its height if the air resistance is ignored ?
View SolutionA ball is thrown vertically upwards. Which of the following plots represents the speed-time graph of the ball during its height if the air resistance is not ingnored ?
View SolutionA ball is thrown vertically upwards and comes back.Which of the following graph represents the velocity-time graph of the ball during its flight?
View SolutionA ball is thrown vertically upwards. Which of the following graph/graphs represent velocity-time graph of the ball during its flight (air resistance is neglected)
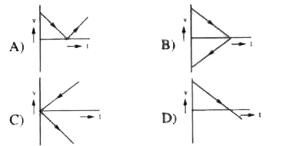
View SolutionA ball is thrown vertically upwards. Which of the following graph/graphs represent velocity time graph of the ball during its flight ( air resistance is neglected).
View SolutionA ball is thrown vertically upwards. Which of the following graph/graphs represent velocity-time graph of the ball during its flight (air resistance is neglected)
View SolutionA ball is thrown vertically upwards .Which of the following graph/graphs represent velocity-time graph of the ball during its flight (air resistance is neglected )
View SolutionA ball is thrown vertically upwards. Which of the following graph/graphs represent velocity-time graph of the ball during its flight (air resistance is neglected)

View SolutionA ball is thrown vertically upwards. Which of the following graph/graphs represent velocity-time graph of the ball during its flight (air resistance is neglected)

View Solutionएक गेंद को ऊर्ध्वाधर ऊपर की ओर प्रक्षेपित किया गया है | निम्न ग्राफ में से कौन-सा ग्राफ गेंद की हवा में गति के लिए वेग समय ग्राफ को दर्शाता है | ( हवा का प्रतिरोध नगण्य है ) -
View SolutionA ball is thrown vertically upward. For the motion of the ball till it returns to ground, draw the:- velocity vs time graph.
View SolutionA ball is thrown vertically upward. For the motion of the ball till it returns to ground, draw the:- height vs time graph.
View SolutionA ball is thrown vertically upwards. Which of the following plots represent the speed graph of the ball during its flight if the air resistence is not ignored?
View SolutionA ball is thrown vertically upwards. Which of the following plots represent the speed graph of the ball during its flight if the air resistence is not ignored?
View SolutionA ball is thrown vertically upwards. Which of the following plots represent the speed graph of the ball during its flight if the air resistence is not ignored?
View Solution