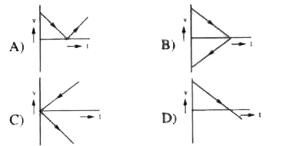
A ball is thrown vertically upwards. Which of the following plots represent the speed graph of the ball during its flight if the air resistence is not ignored?
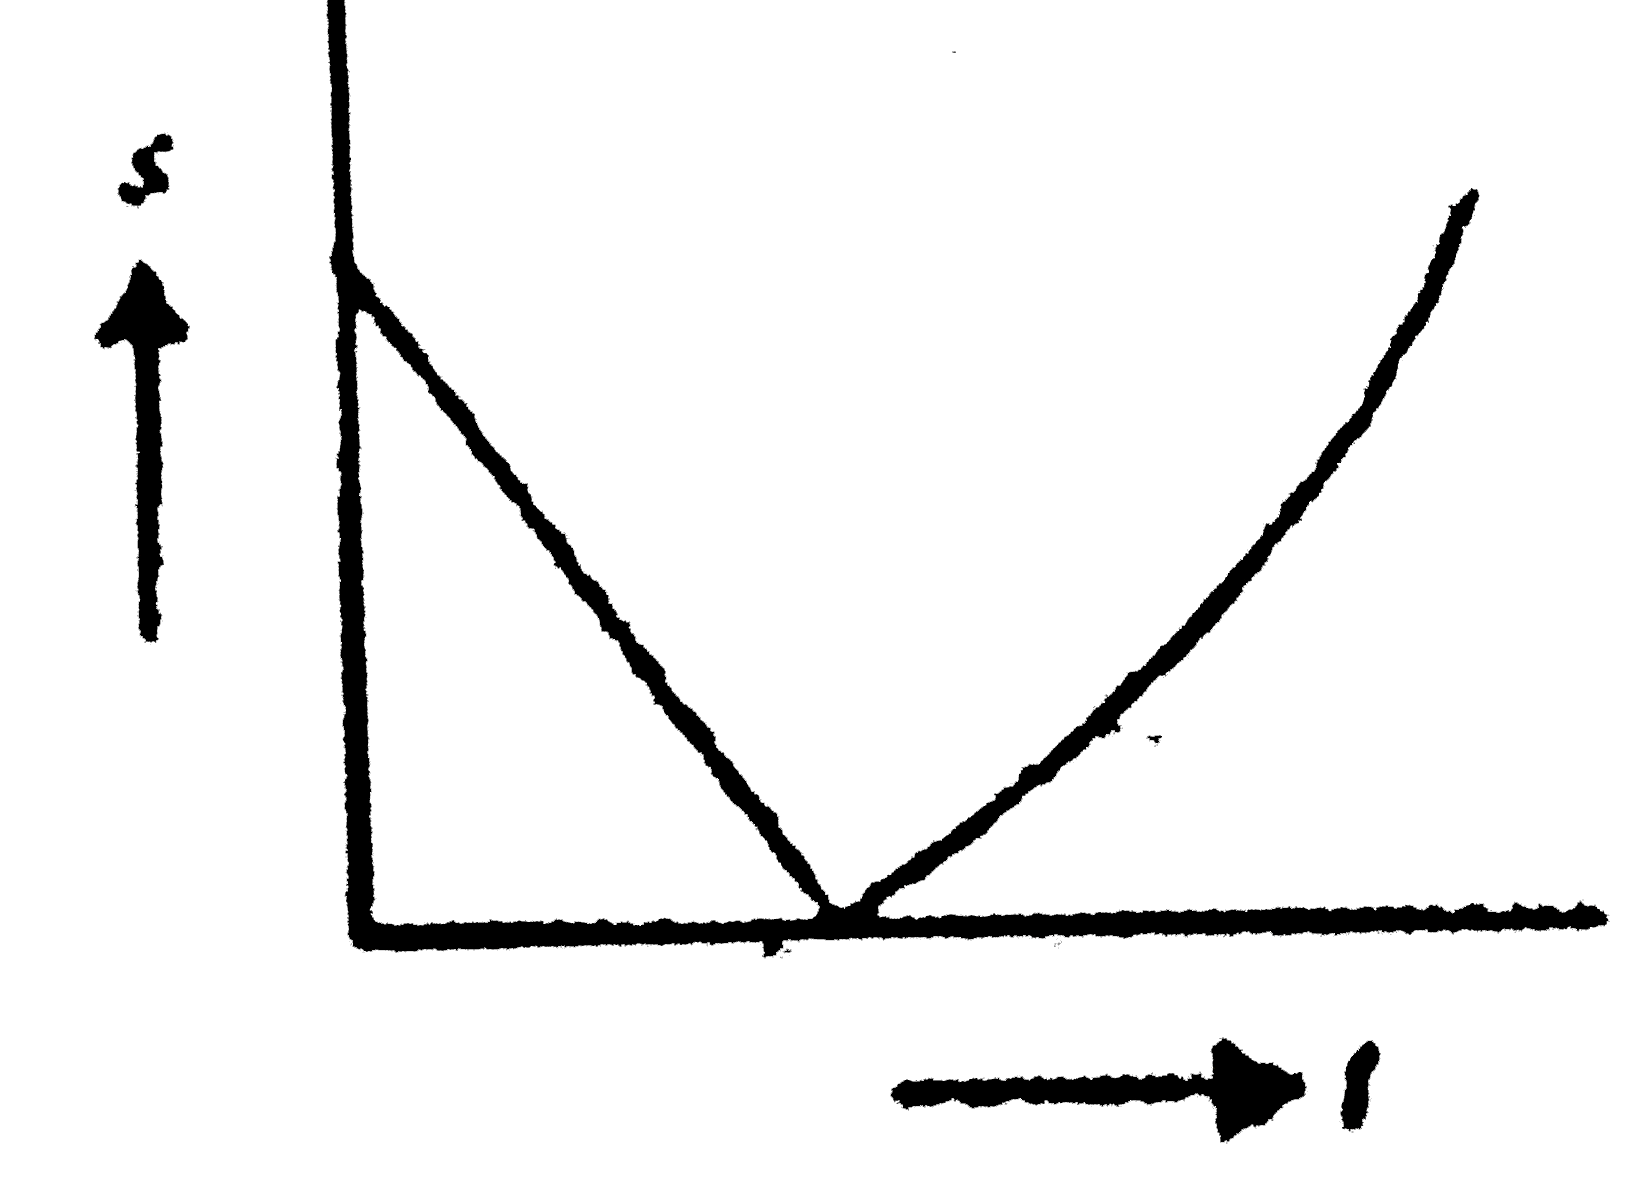
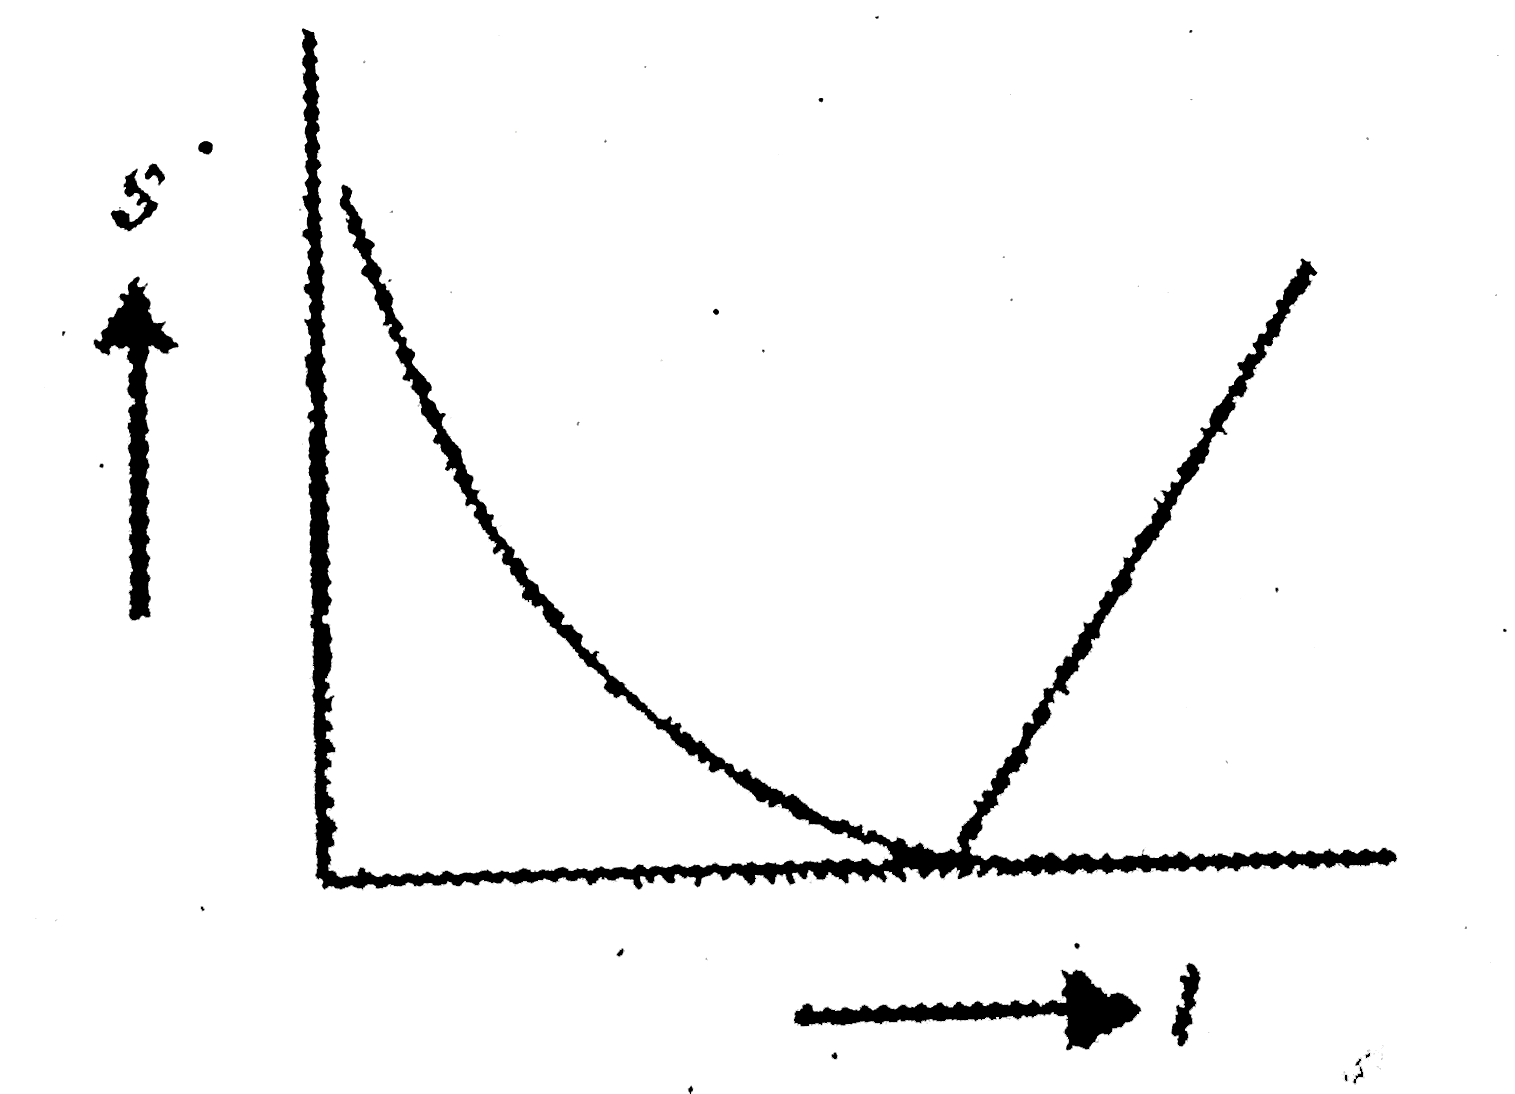
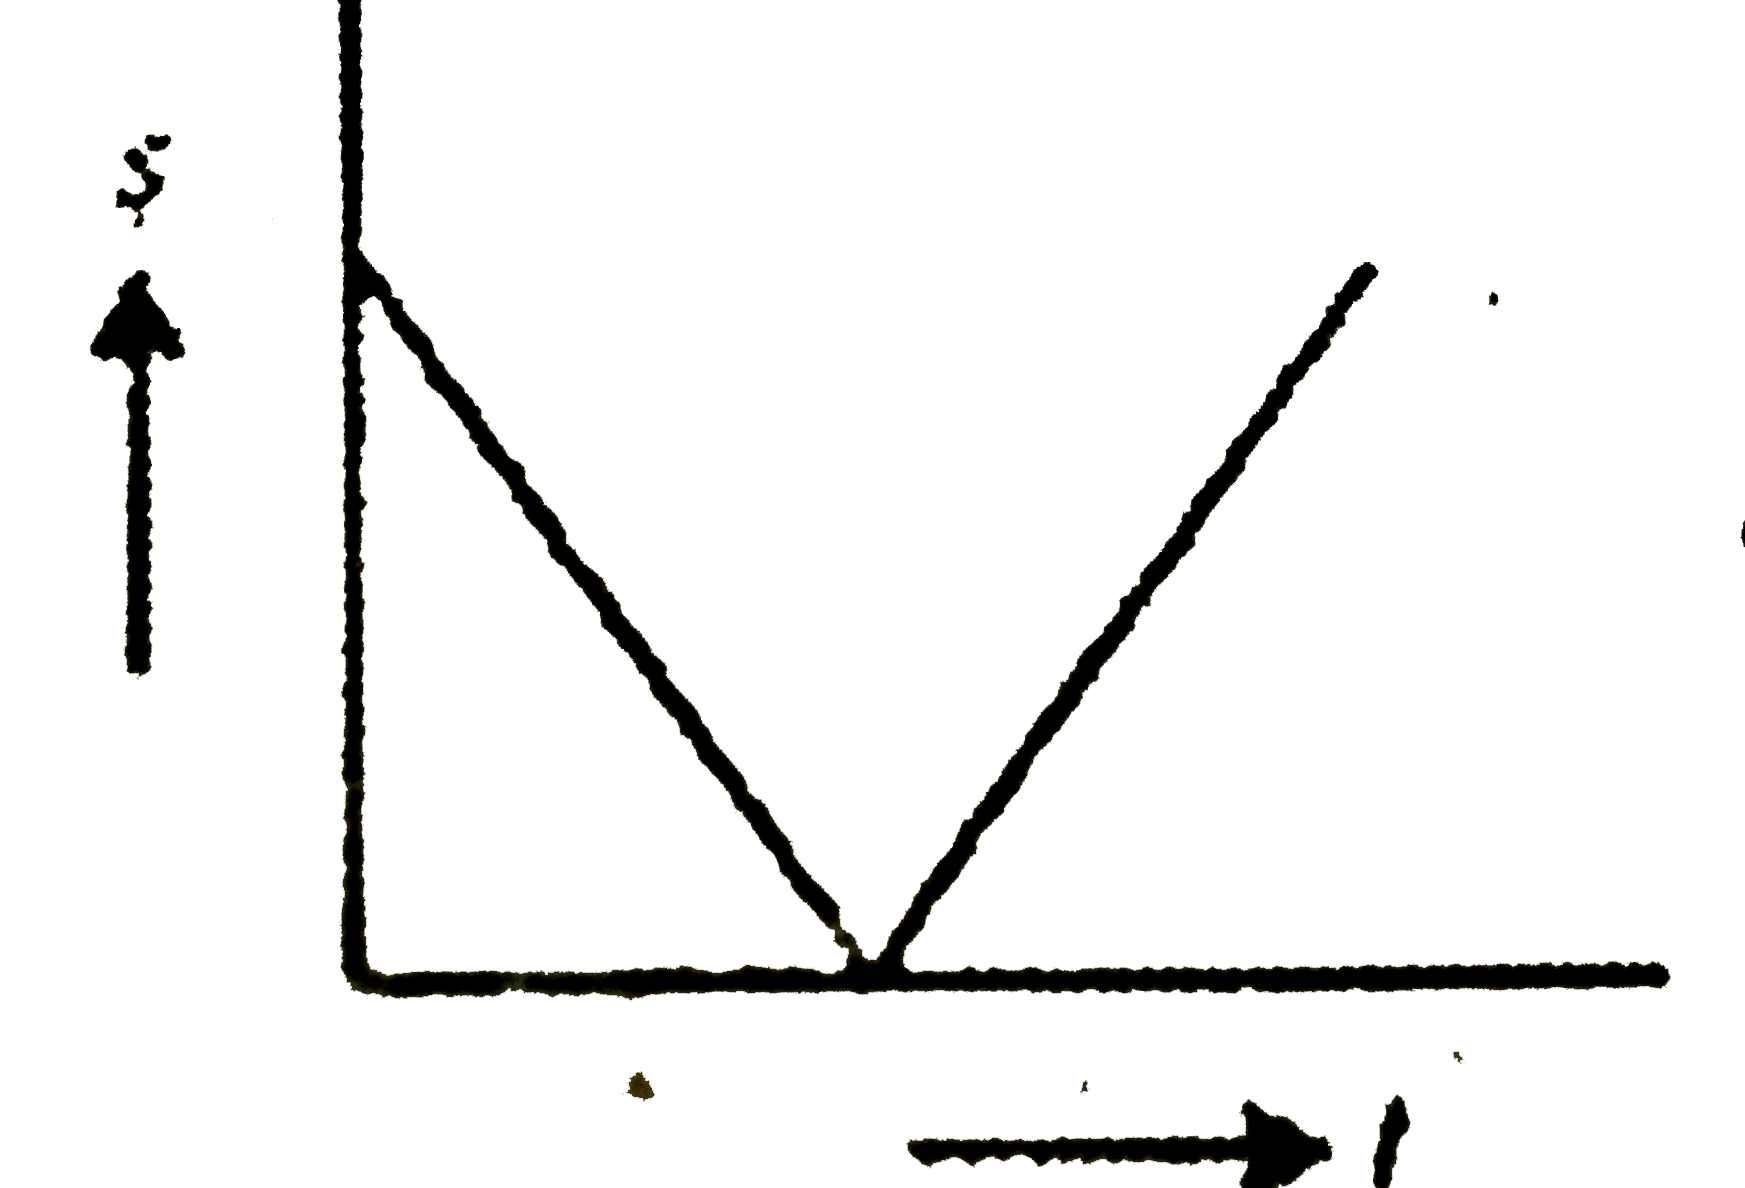
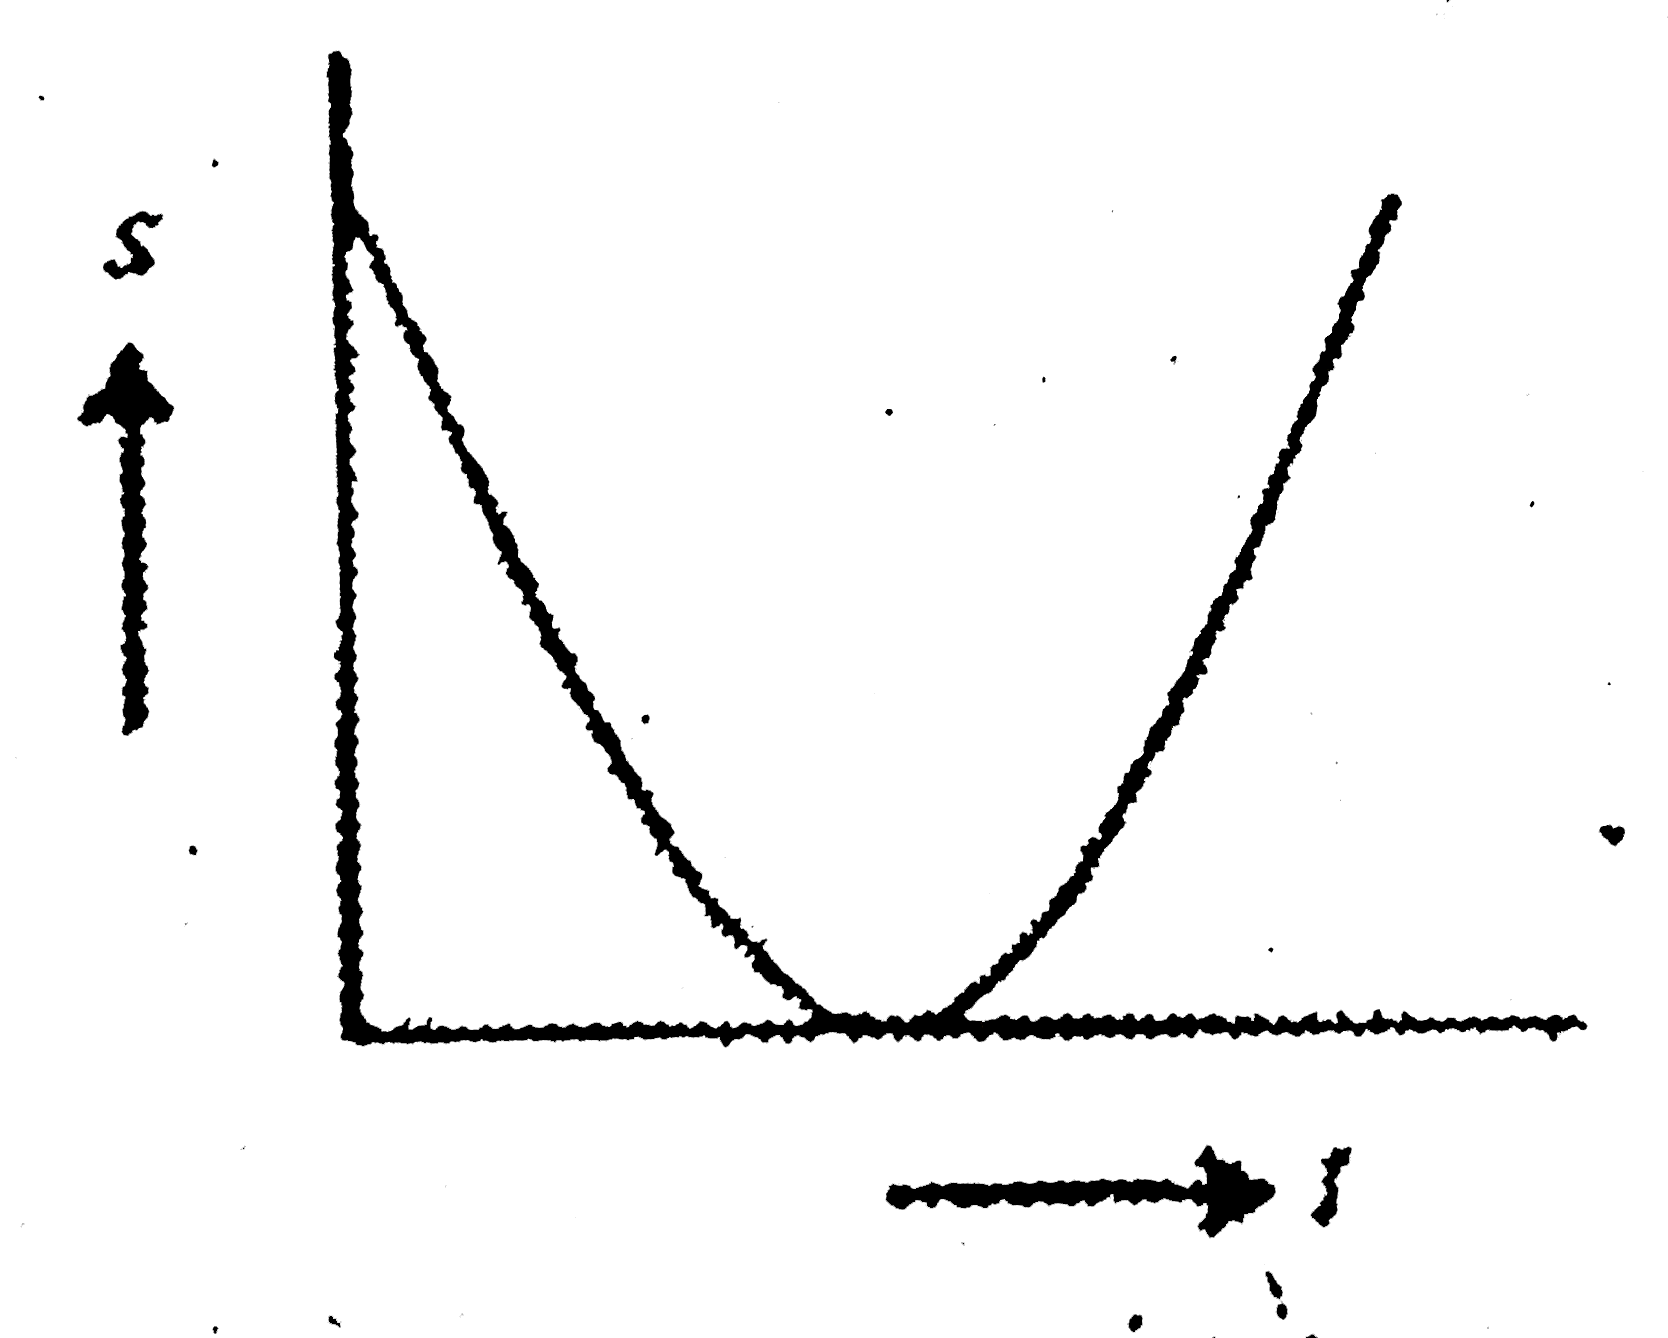
The correct Answer is:D
To solve the problem, we need to analyze the motion of a ball thrown vertically upwards while considering air resistance. Here’s a step-by-step breakdown of the solution:
Step 1: Understand the Motion of the Ball
When a ball is thrown vertically upwards, it experiences two main forces: the initial upward force (due to the throw) and the downward gravitational force. Additionally, air resistance opposes the motion of the ball.
Step 2: Analyze the Upward Motion
During the upward motion:
- The ball's speed decreases due to the gravitational pull and air resistance.
- The equation of motion can be represented as:
V=U−gt
where V is the final velocity, U is the initial velocity, g is the acceleration due to gravity, and t is time.
Step 3: Analyze the Downward Motion
When the ball reaches its highest point, it starts descending:
- The speed increases, but air resistance will reduce the acceleration.
- The equation for downward motion can be represented as:
V=U+gt
However, since air resistance is present, the acceleration will be less than g.
Step 4: Consider the Effect of Air Resistance
With air resistance:
- The speed will not decrease to zero at the same rate during the upward motion.
- The speed will not increase during the downward motion as quickly as it would without air resistance.
- The speed-time graph will not be linear; instead, it will curve.
Step 5: Sketch the Speed-Time Graph
- The graph will start at U (initial speed) and curve downwards as the ball rises, indicating a decrease in speed due to gravity and air resistance.
- At the peak, the speed will be zero.
- As the ball falls, the speed will increase but at a decreasing rate due to air resistance, resulting in a curve that rises less steeply than it would without air resistance.
Conclusion
The speed-time graph will show a curve that decreases during the upward motion and increases during the downward motion, but the increase will be less steep than the decrease.
Final Answer
From the options provided, the correct plot representing the speed graph of the ball during its flight, considering air resistance, is the one that shows a curved line for both upward and downward motion.
---
When a ball is thrown vertically upwards, it experiences two main forces: the initial upward force (due to the throw) and the downward gravitational force. Additionally, air resistance opposes the motion of the ball.
During the upward motion:
- The ball's speed decreases due to the gravitational pull and air resistance.
- The equation of motion can be represented as:
V=U−gt
where V is the final velocity, U is the initial velocity, g is the acceleration due to gravity, and t is time.
When the ball reaches its highest point, it starts descending:
- The speed increases, but air resistance will reduce the acceleration.
- The equation for downward motion can be represented as:
V=U+gt
However, since air resistance is present, the acceleration will be less than g.
With air resistance:
- The speed will not decrease to zero at the same rate during the upward motion.
- The speed will not increase during the downward motion as quickly as it would without air resistance.
- The speed-time graph will not be linear; instead, it will curve.
- The graph will start at U (initial speed) and curve downwards as the ball rises, indicating a decrease in speed due to gravity and air resistance.
- At the peak, the speed will be zero.
- As the ball falls, the speed will increase but at a decreasing rate due to air resistance, resulting in a curve that rises less steeply than it would without air resistance.
The speed-time graph will show a curve that decreases during the upward motion and increases during the downward motion, but the increase will be less steep than the decrease.
From the options provided, the correct plot representing the speed graph of the ball during its flight, considering air resistance, is the one that shows a curved line for both upward and downward motion.
Similar Questions
Which of the following is wheat fruit?
View SolutionA ball is thrown vertically upwards. Which of the following plots represents the speed-time graph of the ball during its height if the air resistance is ignored ?
View SolutionA ball is thrown vertically upwards. Which of the following graph/graphs represent velocity-time graph of the ball during its flight (air resistance is neglected)
View SolutionA body is thrown vertically upwards. Which one of the following graphs correctly represent the velocity vs time?
View SolutionA ball is thrown vertically upward. What is the magnitude of velocity at the highest point ?
View SolutionA ball is thrown vertically upwards. It returns 6 s later. Calculate the greatest height reached by the ball
View SolutionA ball is thrown vertically upwards, its motion is uniform throughout. True/False.
View SolutionA ball thrown vertically upwards with an initial velocity of 1.4m/s. The total displcement of the ball is
View SolutionA ball thrown vertically upward with initial velocity u. Which of the following graphs represent the velocity of ball correctly as function of time?
(Take upward direction as positive)
View SolutionA ball is thrown vertically upwards from the ground. If T1 and T2 are the respective time taken in going up and coming down, and the air resistance is not ignored, then
View Solution
