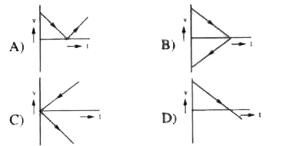
A ball is thrown vertically upwards. Which of the following plots represent the speed graph of the ball during its flight if the air resistence is not ignored?
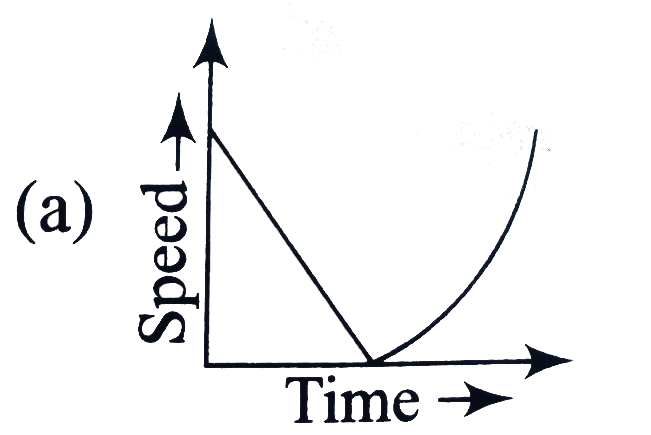
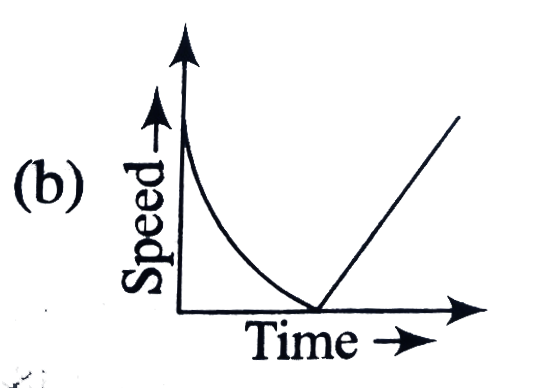
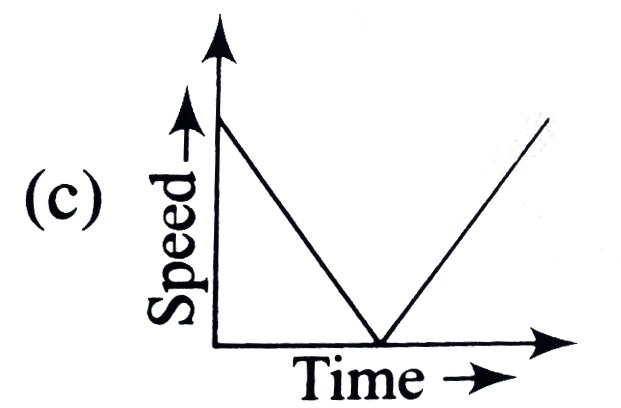
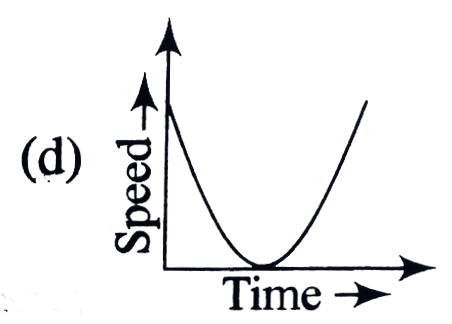
The correct Answer is:C
for upward motion
Effective acceleration =−(g+a)
And for downward motion
Effective acceleration =(g−a)
But both are constants. So the slope of speed-time graph will be constant.
Similar Questions
Which of the following is wheat fruit?
View SolutionA ball is thrown vertically upwards. Which of the following plots represents the speed-time graph of the ball during its height if the air resistance is ignored ?
View SolutionA ball is thrown vertically upwards. Which of the following graph/graphs represent velocity-time graph of the ball during its flight (air resistance is neglected)
 View Solution
A body is thrown vertically upwards. Which one of the following graphs correctly represent the velocity vs time?
View SolutionA ball is thrown vertically upward. What is the magnitude of velocity at the highest point ?
View SolutionA ball is thrown vertically upwards. It returns 6 s later. Calculate the greatest height reached by the ball
View SolutionA ball is thrown vertically upwards, its motion is uniform throughout. True/False.
View SolutionA ball thrown vertically upwards with an initial velocity of 1.4m/s. The total displcement of the ball is
View SolutionA ball thrown vertically upward with initial velocity u. Which of the following graphs represent the velocity of ball correctly as function of time?
(Take upward direction as positive)View SolutionA ball is thrown vertically upwards from the ground. If T1 and T2 are the respective time taken in going up and coming down, and the air resistance is not ignored, then
View Solution

