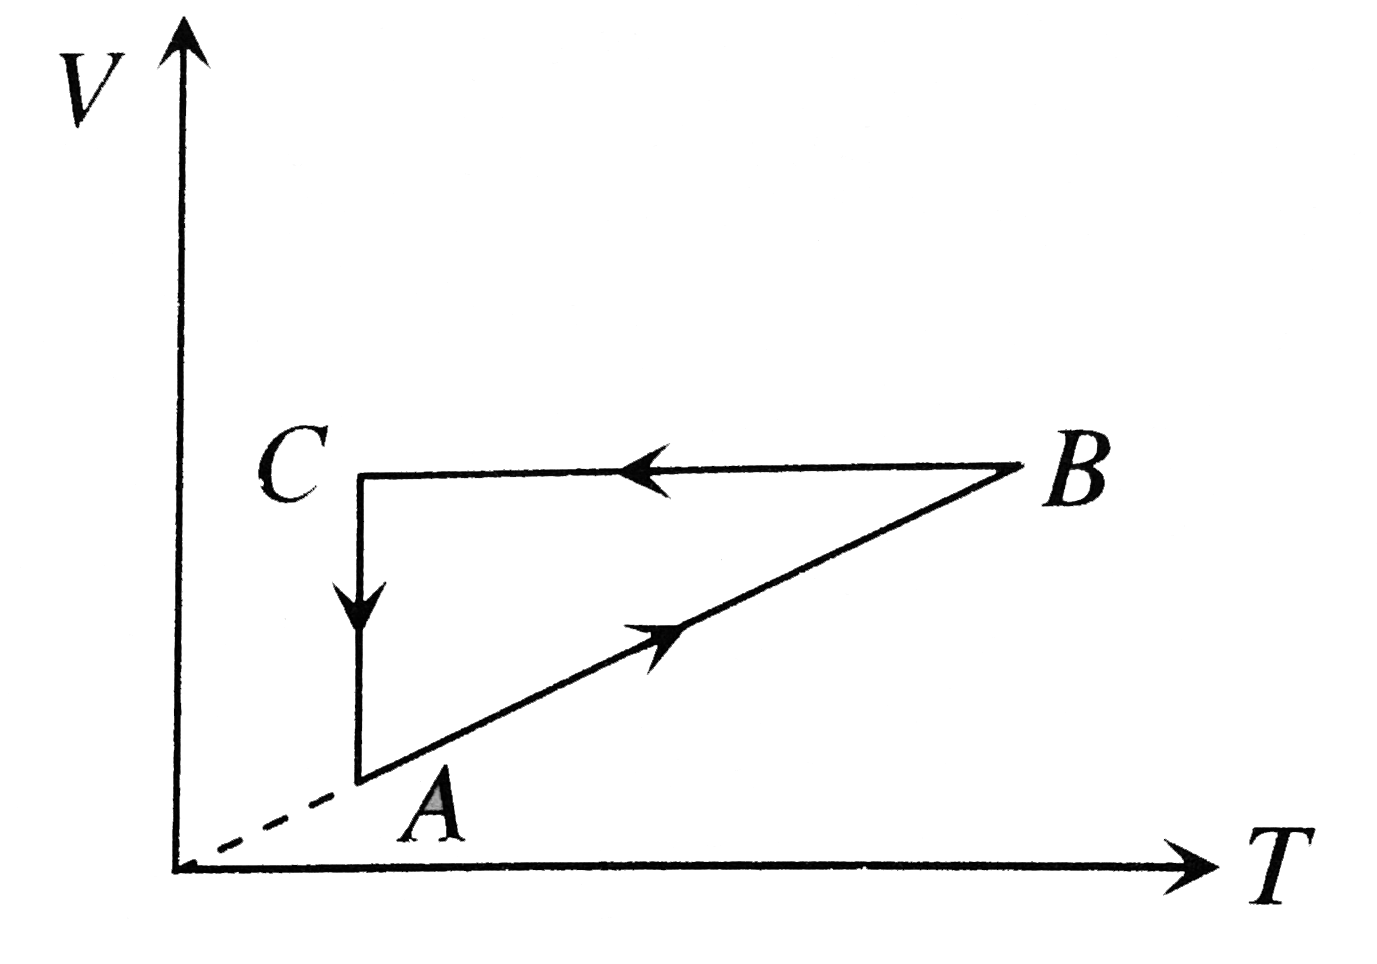
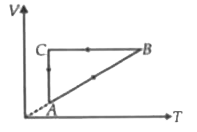
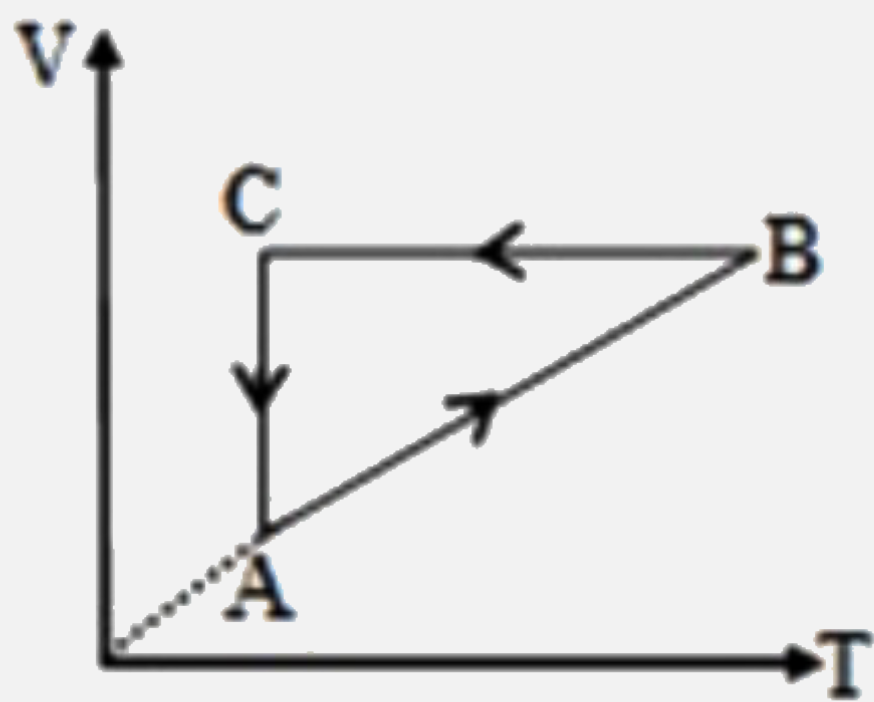
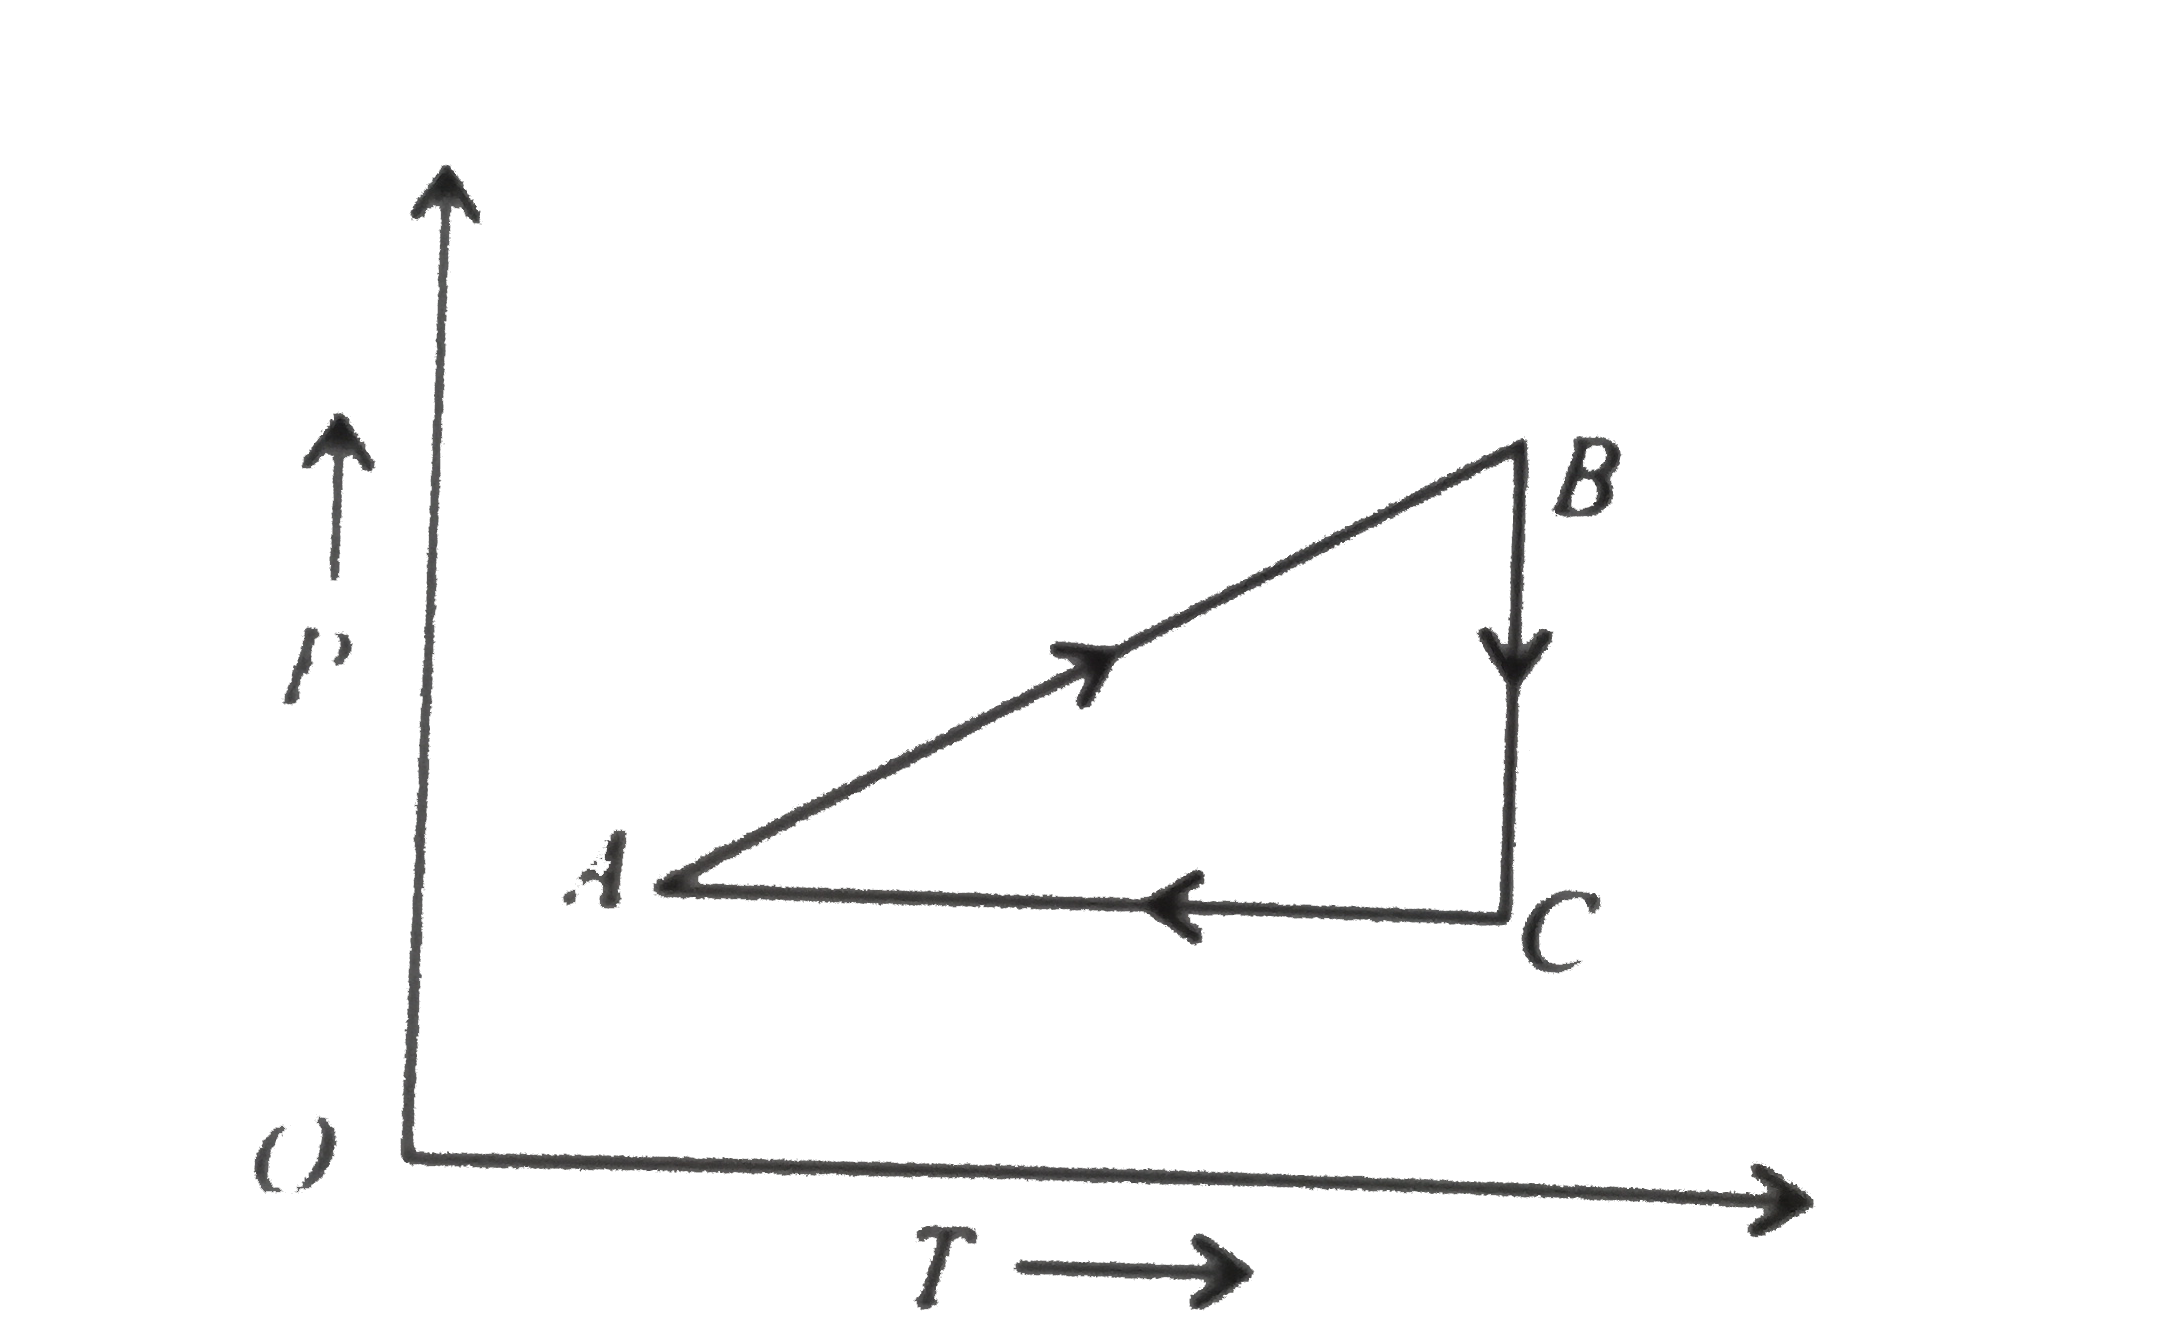
A cyclic process ABCA shown in the V−T diagram is performed with a constant mass of an ideal gas. Show the same process on a p−V diagram. In the figure, CA is parrallel to the Vaxis and BC is parallel to the T-axis.

The correct Answer is:A
A→B A straight line between A and
B in V-T graph indicates V∝T
⇒ Pressure is constant.
B→C Volume is constant. Since the temperature is decreasing, the
pressure should also decrease.
C→A The temperature is constant but volume decrease. The pressure is isothermal.
Topper's Solved these Questions
Similar Questions
A cyclic process ABCA shown in the V-T diagram is performed with a constant mass of an ideal gas. Show the same process on a p-V diagram, In the figure, CA is parrallel to the B-sxis and BC is parallel to the T-axis.<br><imga≤ocr_imageload∈g=lazysrc=https://d10lpgp6xz60nq.cloudfront.net/physics_imagesHCV_VOL2_C24_S01_010_Q01.pngwh=80%mx-autosty≤=background:white;>
View SolutionA Cycle process ABCA shown in V-T diagram Fig. is preformed with a constant mass of an ideal gas. Show the same process on a P-V diagram.
View Solution
Knowledge Check
A cyclic process ABCA is shown in the V−T diagram process on the P−V
 A
A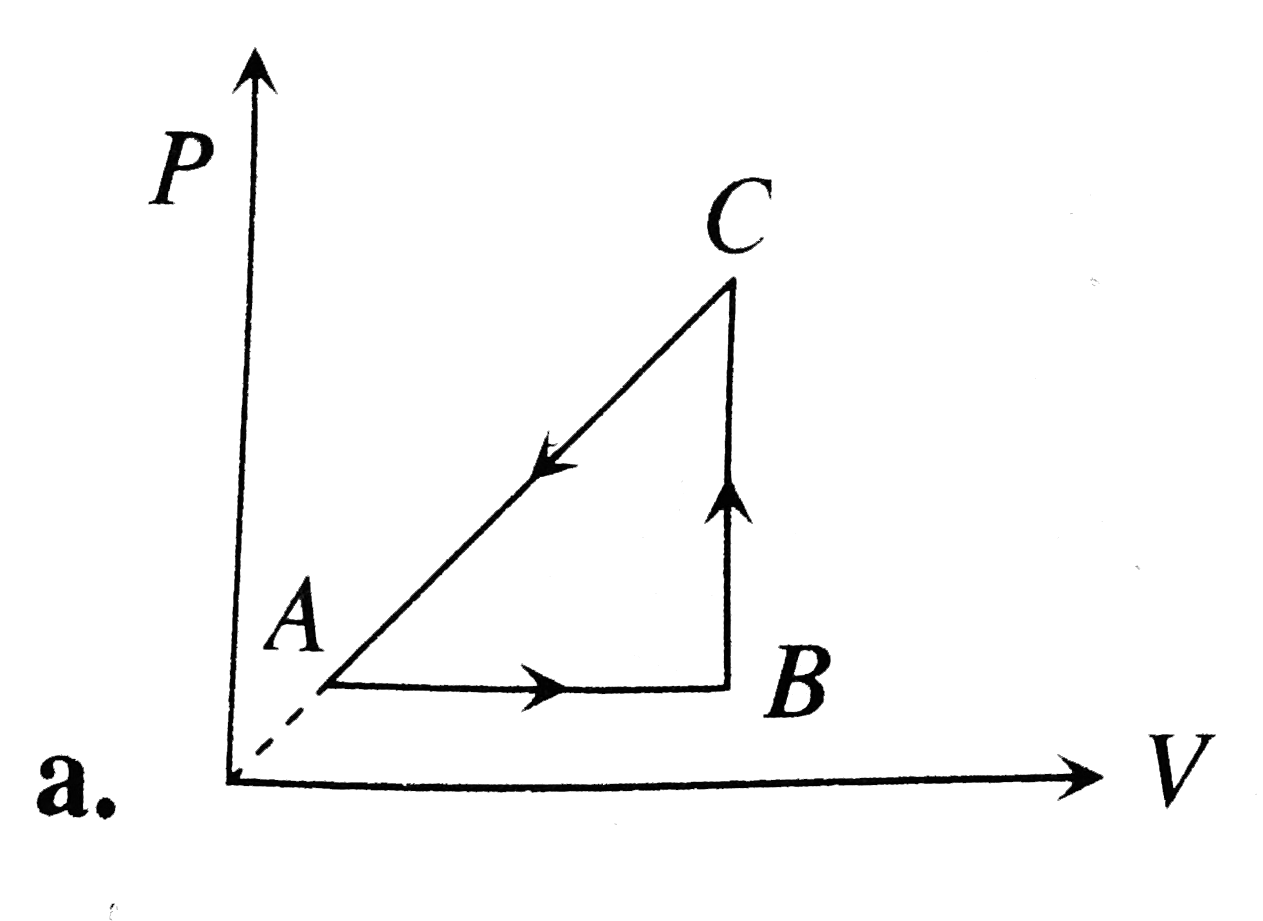 B
B C
C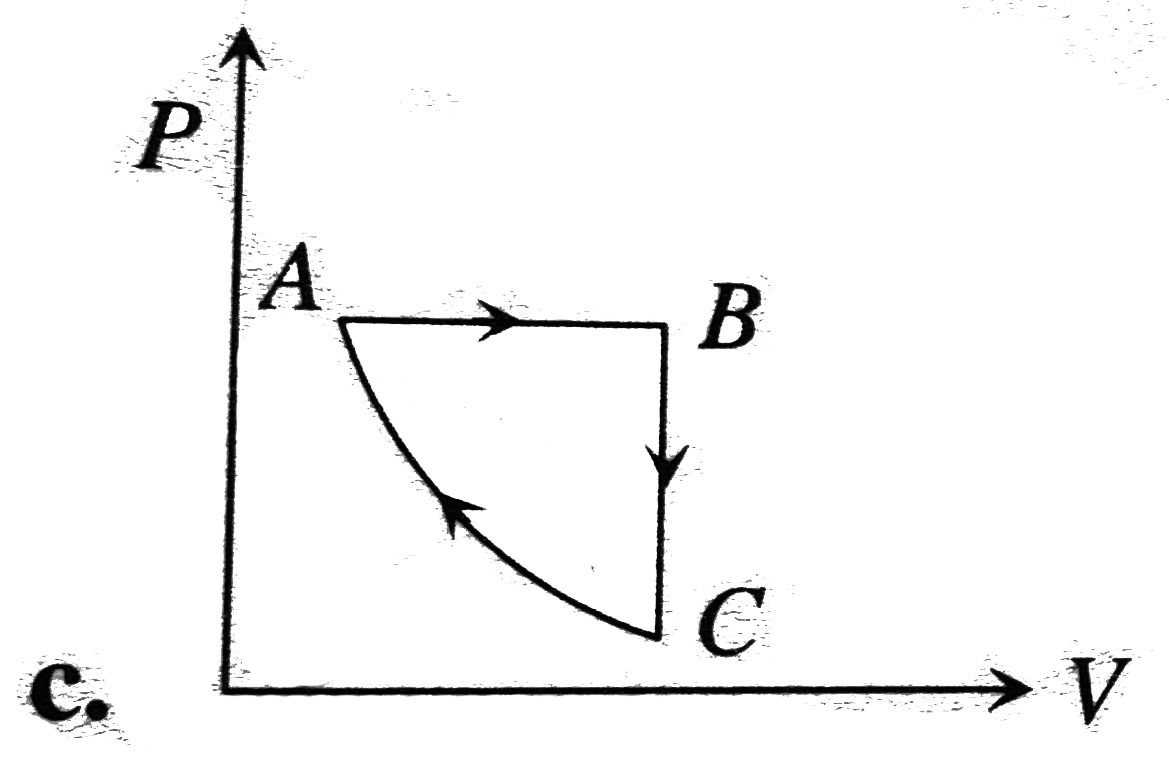 D
D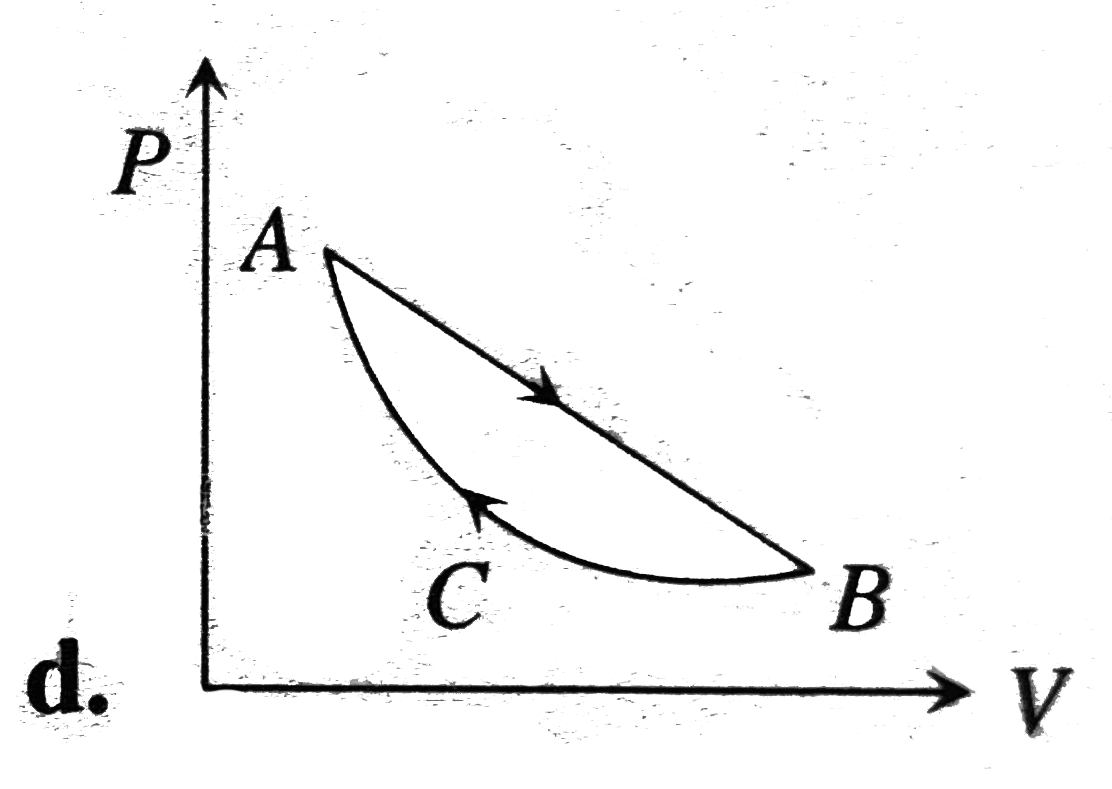
A cyclic process ABCA is shown in the given V-T diagram. Process in the P-V diagram will be
 A
A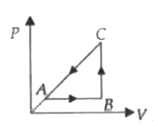 B
B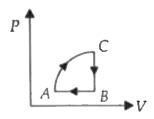 C
C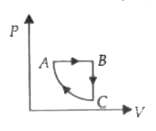 D
D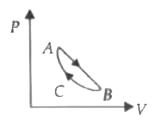
A cyclic process ABC A is shown in P - T diagram. What would be its P – V graph:
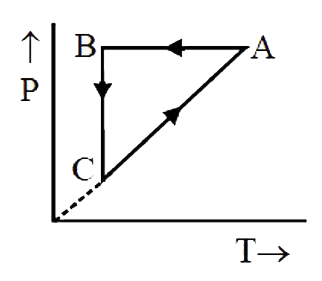 A
A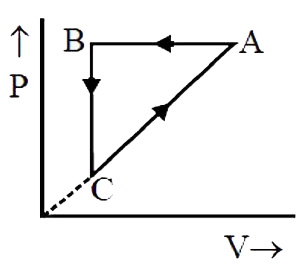 B
B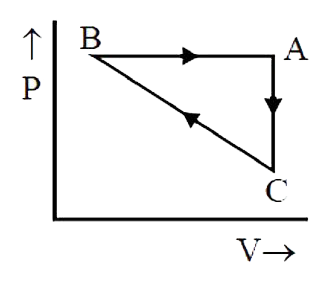 C
C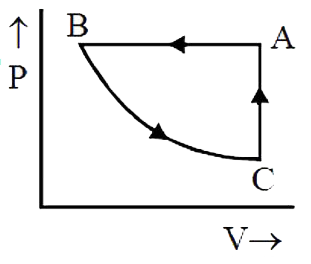 D
D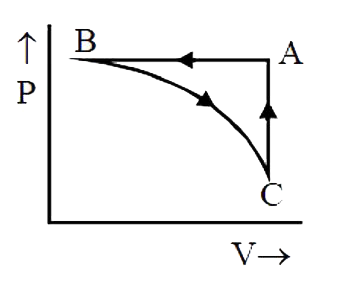
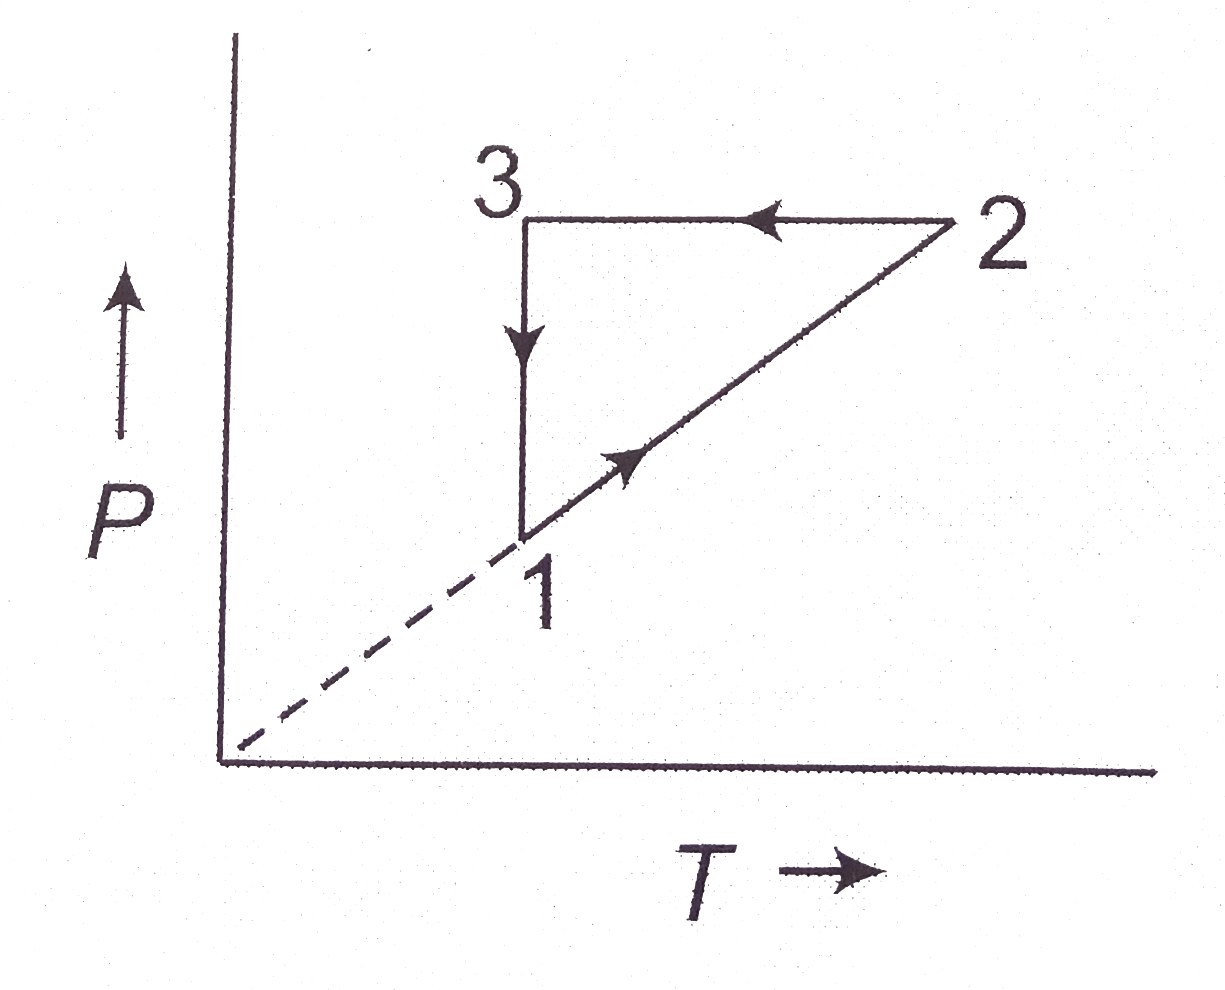
A cyclic process 1→2→3→1 shown in P−T diagram is performed with a constant mass of an ideal gas. Show it on a (a) P−V diagram (b) V−T
View SolutionA cyclic process ABCA is shown in the V - T diagram . Process on the P – V diagram is
View Solution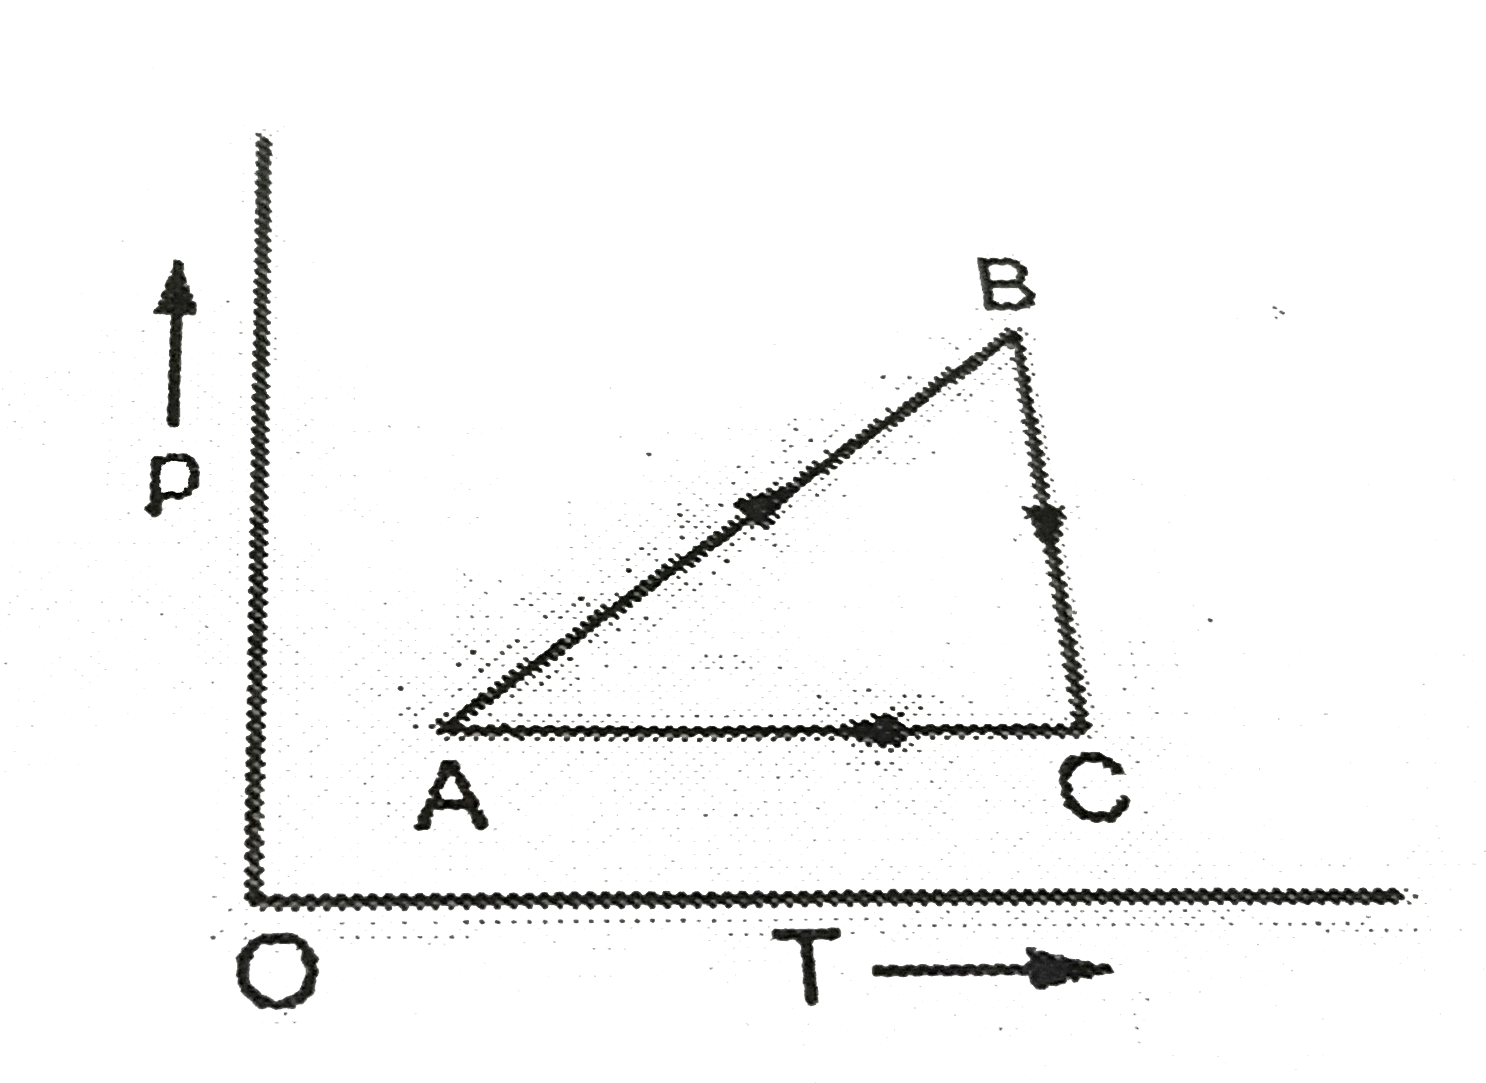
A cyclic process is shown in the p-T diagram. Which of the curves show the same process on a V-T diagram?
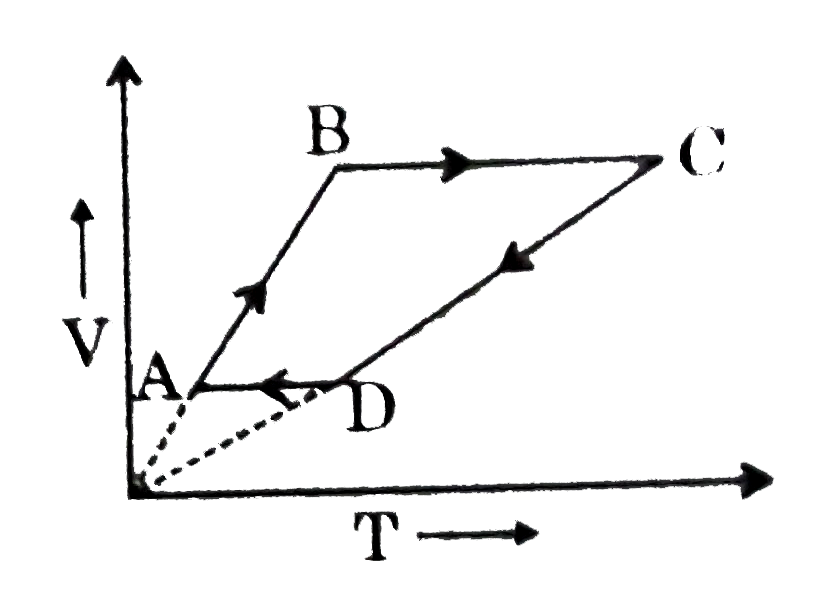
View SolutionA cyclic process ABCD is shown in VT diagram for an ideal gas. Which of the following diagram represents the same process ?
View SolutionA cyclic process is shown in the P−T diagram.
Which of the curve shows the same process on a V−T diagram?
View Solution
