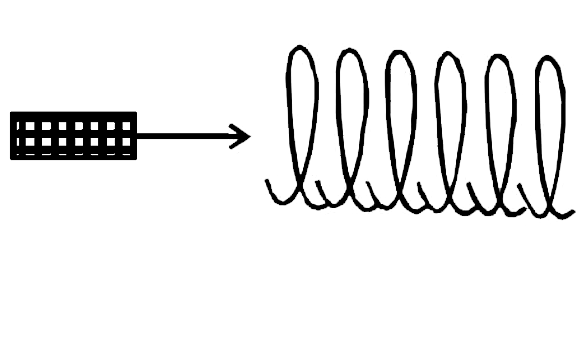
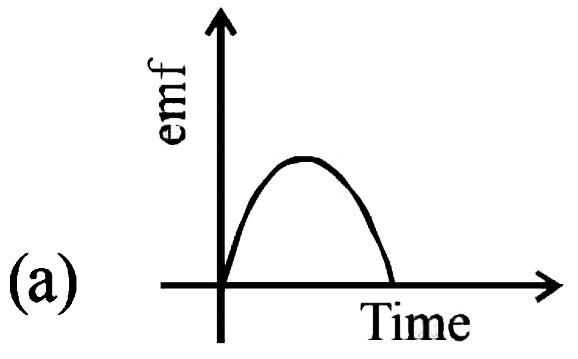
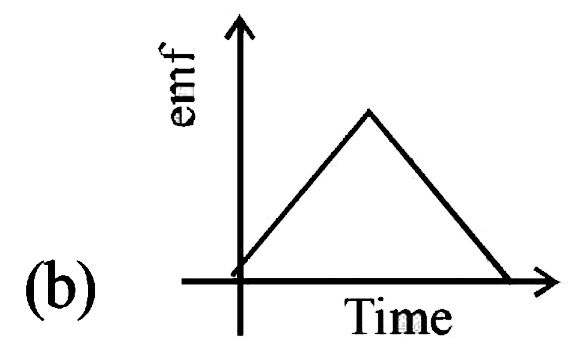
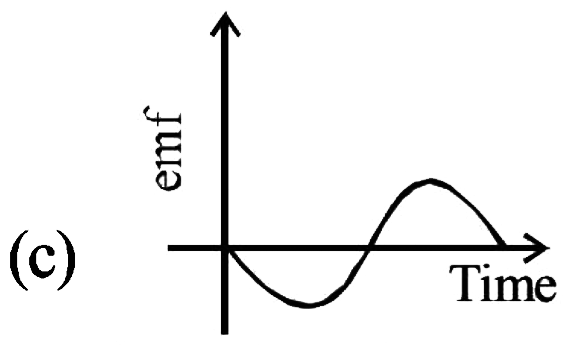
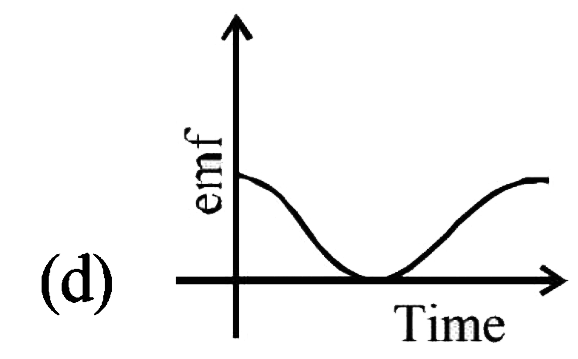
A small bar magnet is being slowly inserted with constant velocity inside a solenoid as shown in figure. Which graph best represents the relationship between emf induced with time
A
B
C
D
Video Solution
Text Solution
The correct Answer is:C
Intentially, (ϕB) increase as magnet approaches the solenoid
∴(ε)=−veand increasing in magnitude. When magnet is moving inside the solenoid, increse in (ϕB) slow down and finally (ϕB) starts decreasing
∴Emfispositiveand∈creasing.
Only graph (c) shows these characteristic.
|
Topper's Solved these Questions
Similar Questions
Knowledge Check
A bar magnet is moved between two parallel circular loop A and B with a constant velocity v as shown in figure.
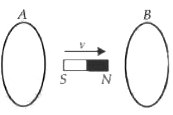 AThe current in each loop flows in the same directionBThe current in each loop flows in opposite directionCThe loops will repel each otherDThe loops will attract each other
Which graph represents the correct relationship between various velocities for an idela gas ?
A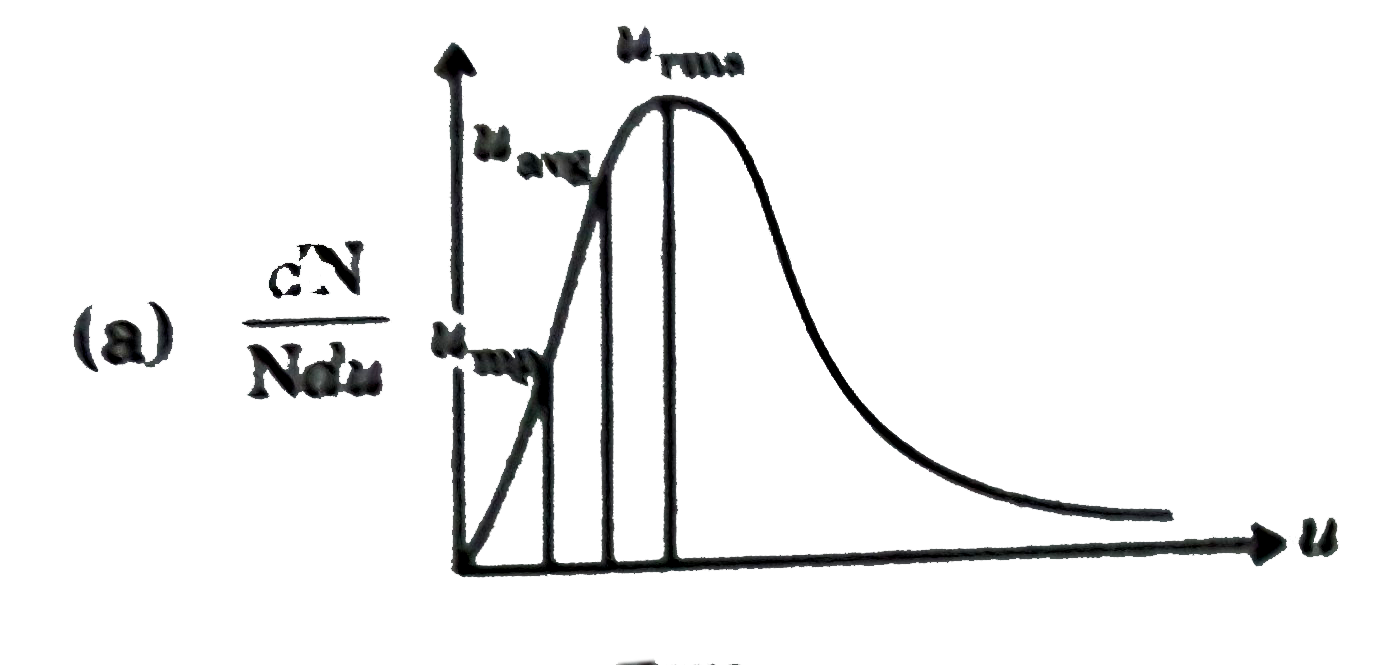 B
B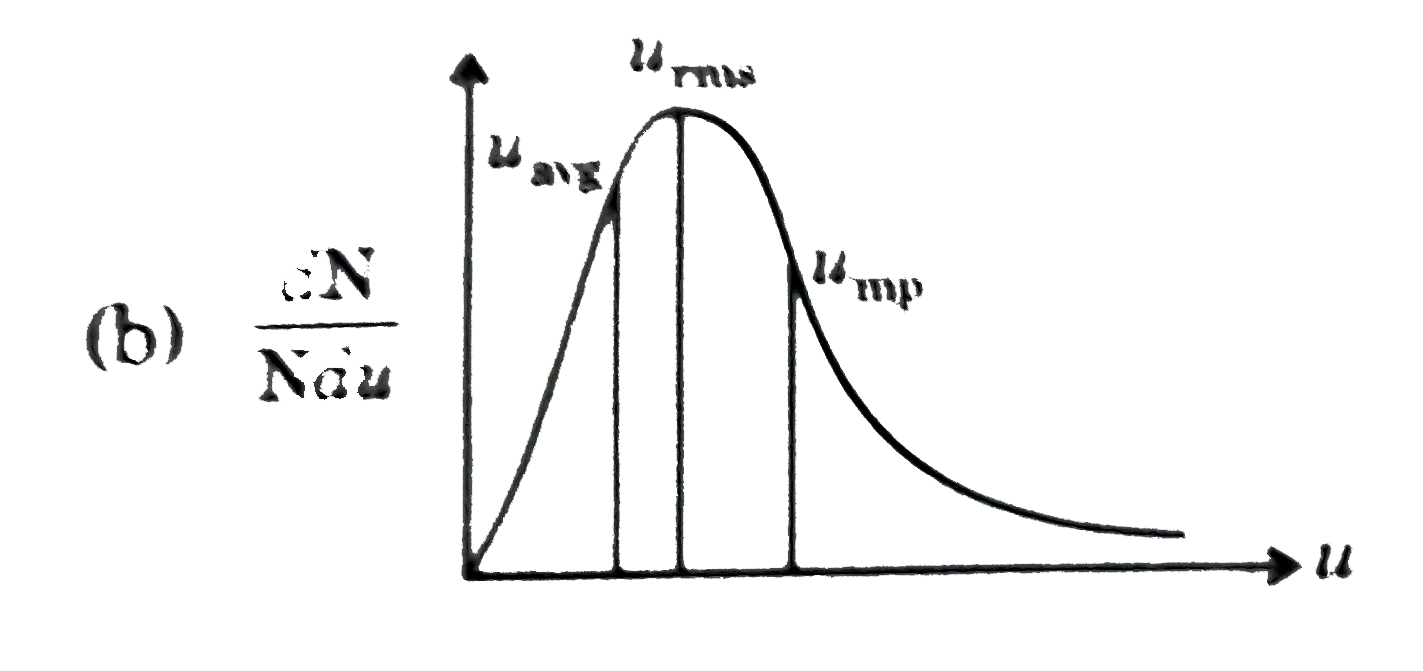 C
C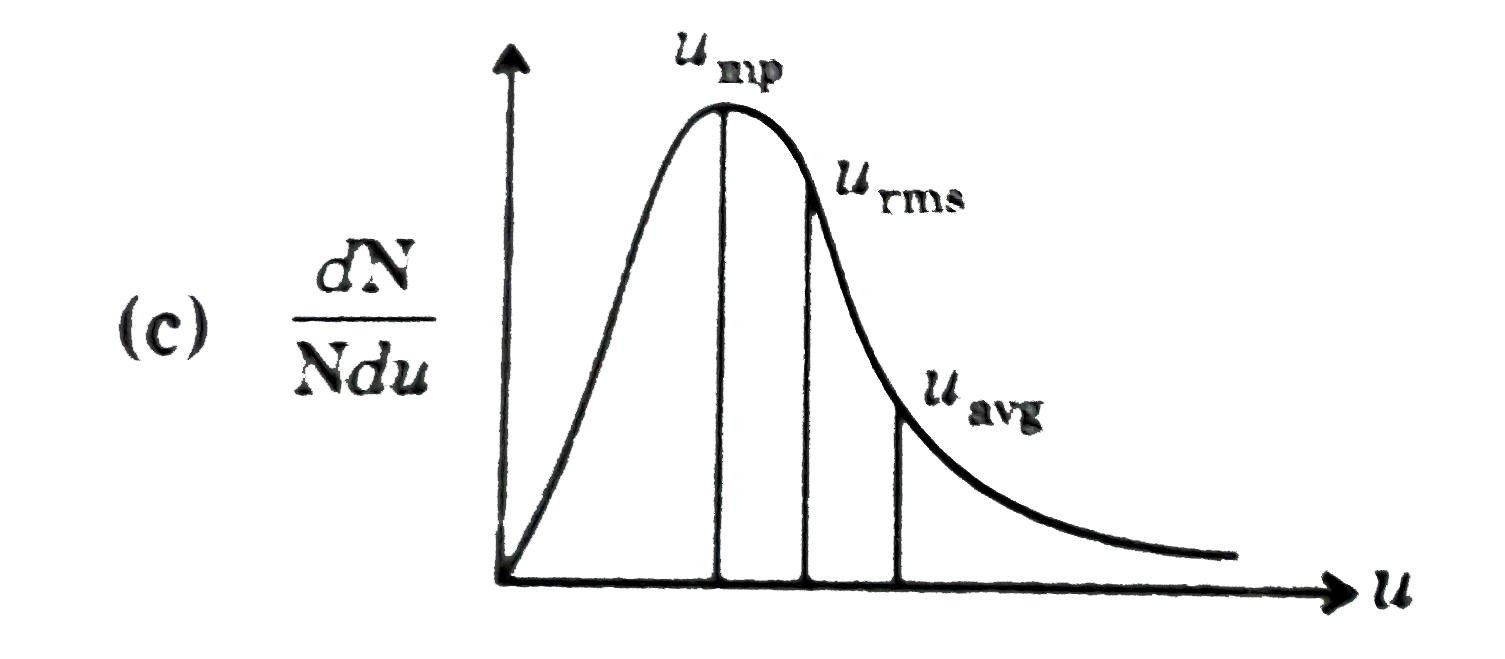 D
D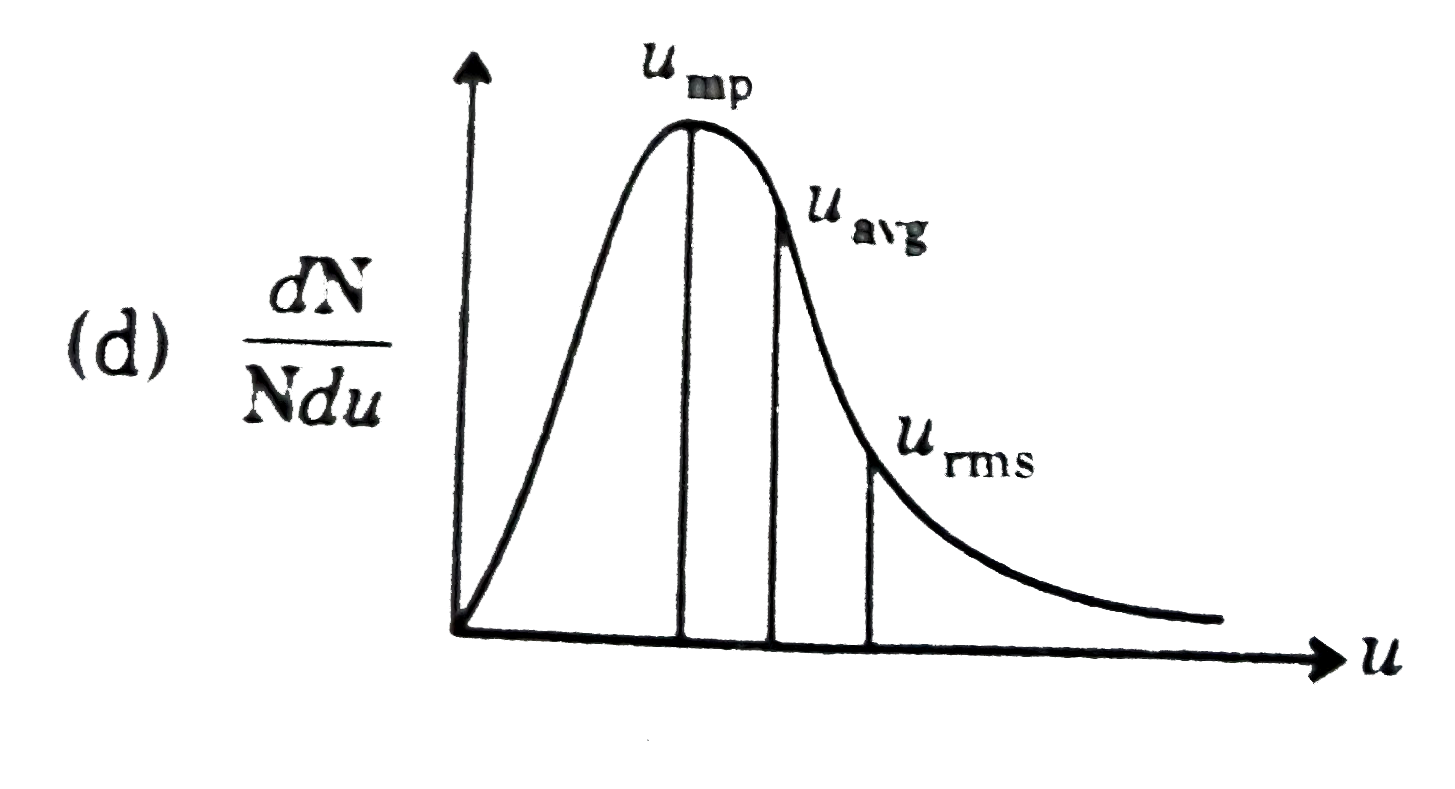
Consider circuit as shown . Which of the graph best represent V-l relationship across the variable resistance R.
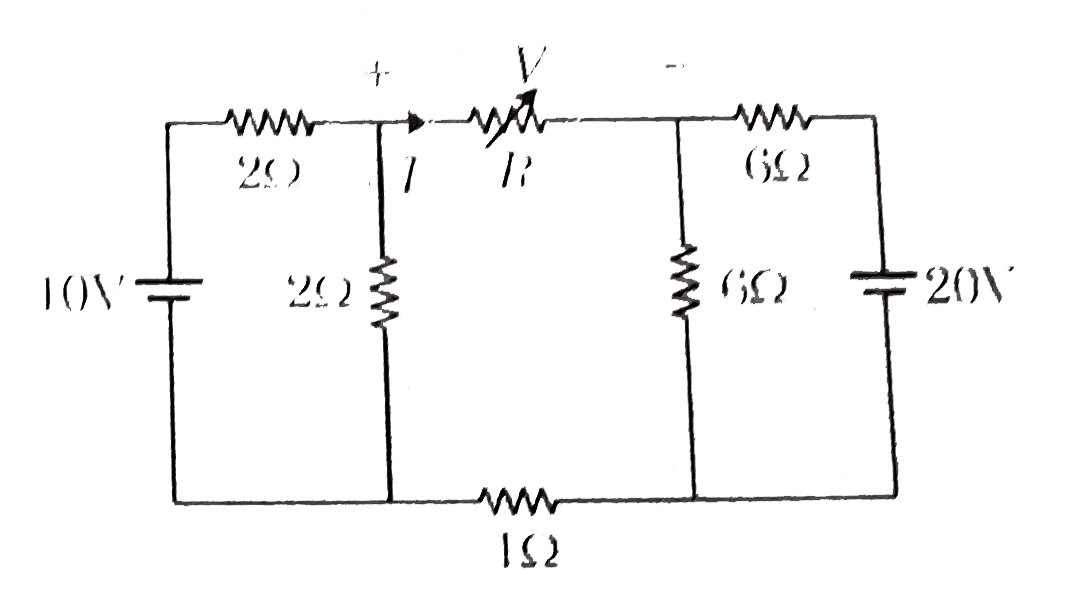 A
A B
B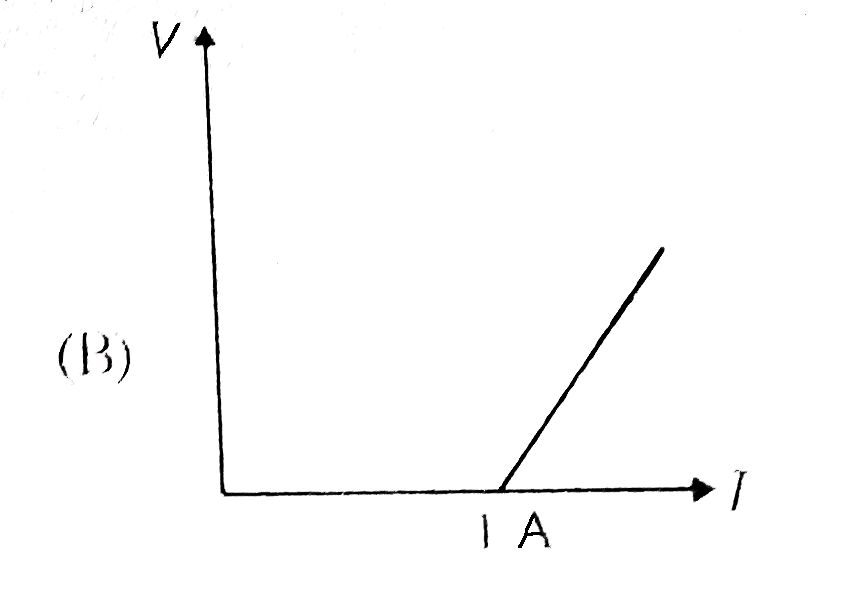 C
C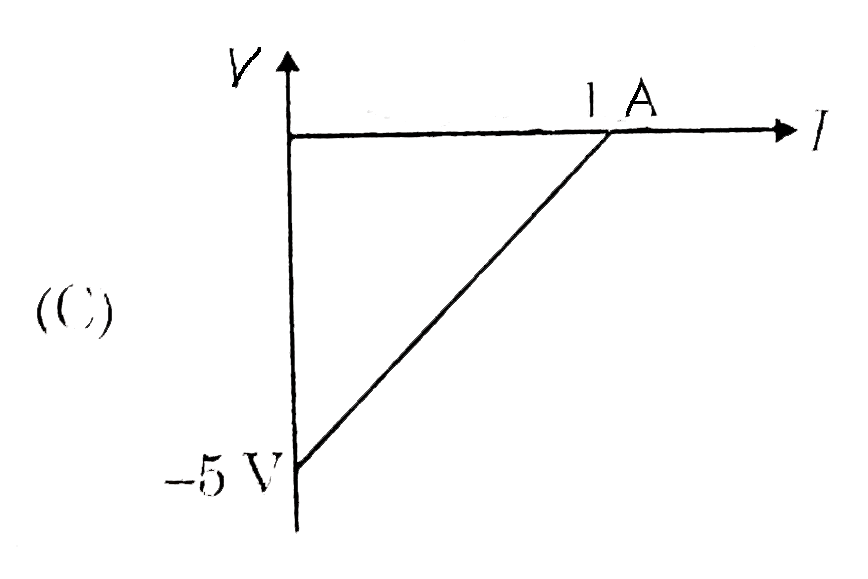 D
D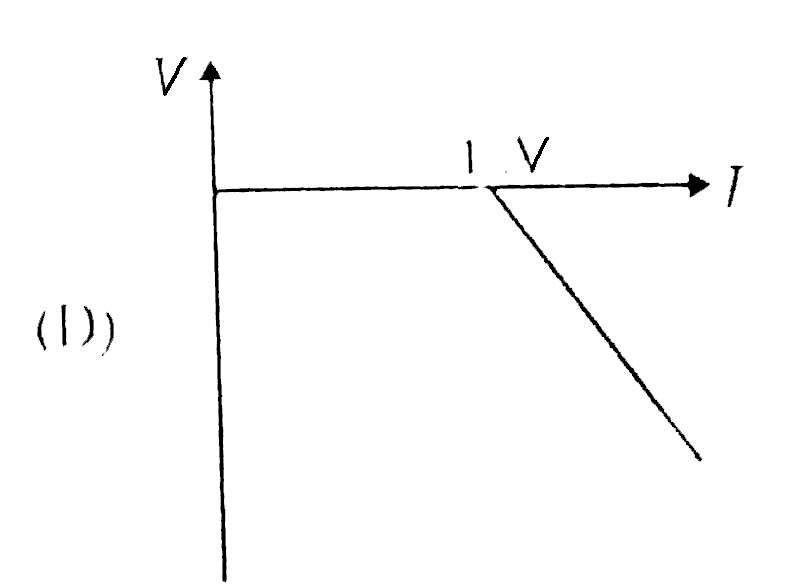
Which figure best represents the relationship between Editor, Newspaper and Journalist?
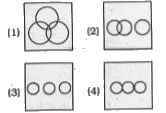
View SolutionWhich combination figure best represents the relationship between mosquitoes, ants and insects?
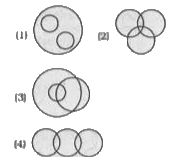
View SolutionWhich of the following Venn diagram best represents the relationship between squares, quadrilaterals and geometrical figures?
View SolutionWhich of the following figure best represents the relationship amongst the Human being. Girl, Boy?
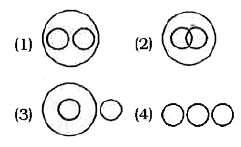
View SolutionWhich of the following Venn diagrams best represents the relationship between the following classes?
Crickets, Players, Human beings
View Solution


