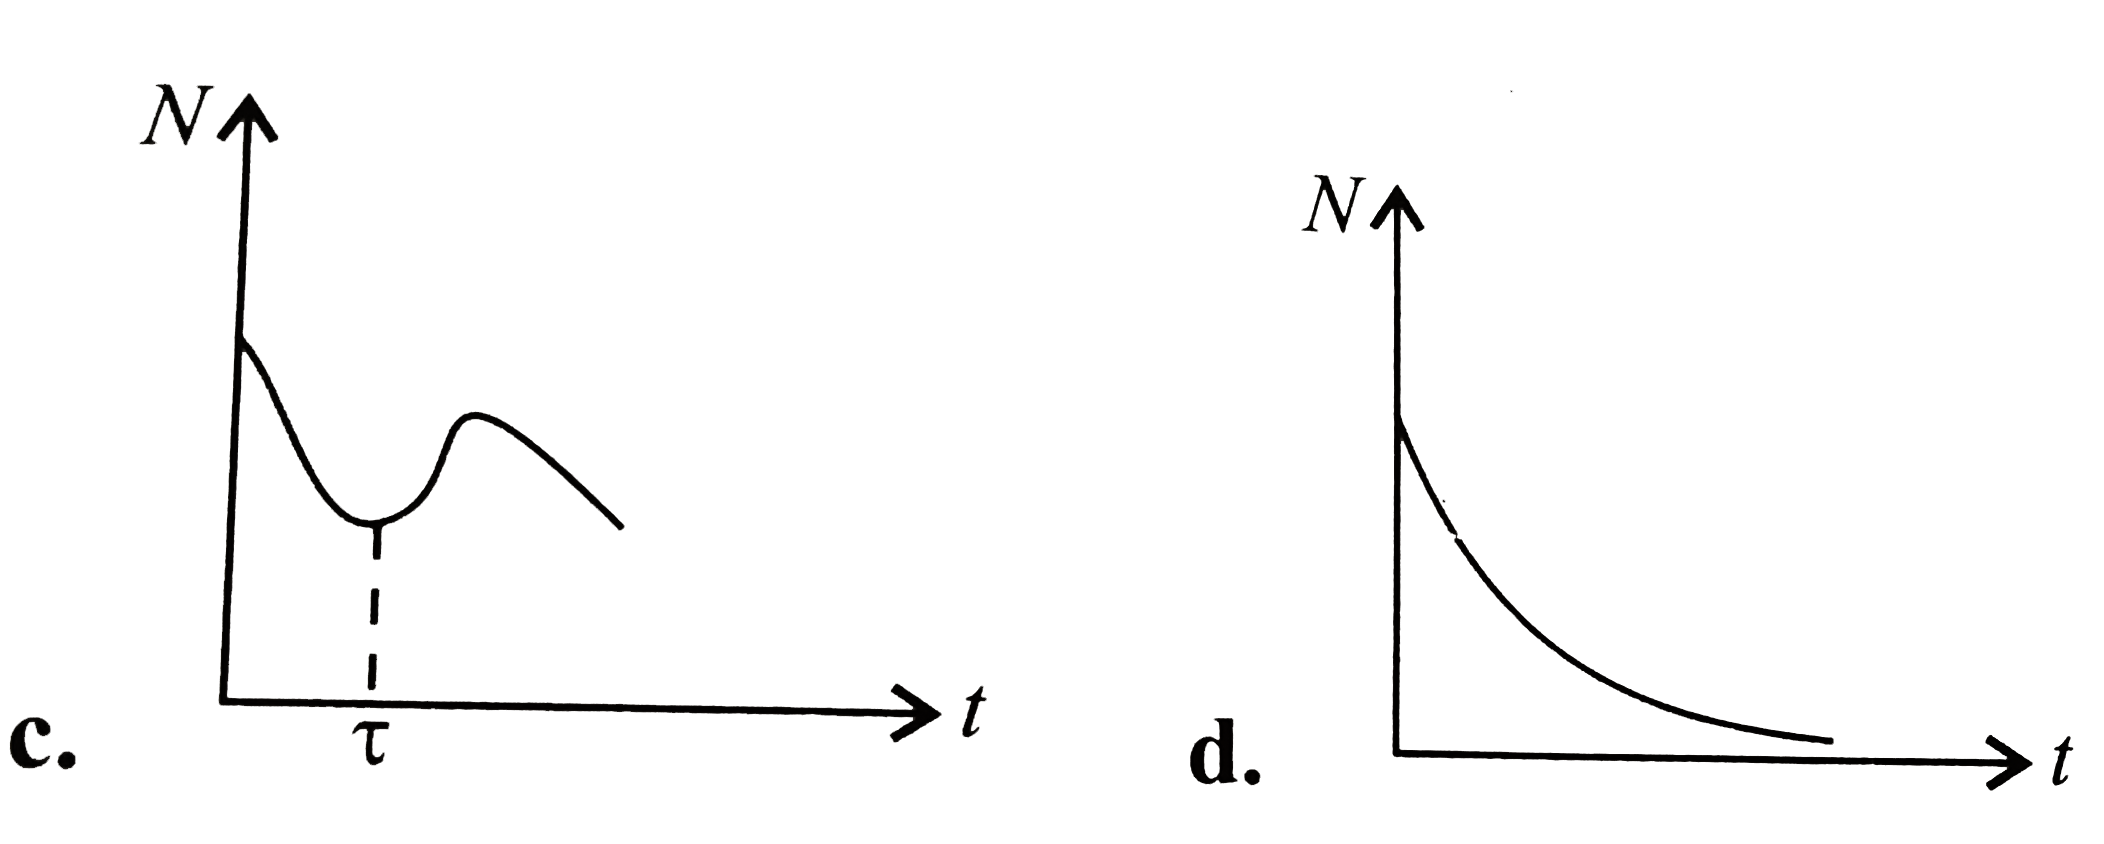
A radicactive sample consider of two distinct species having equial number initially . The mean life time of one species is τ and that of the other is 5τ . The decay prodects in both cases are stable . A plot is made of the total number of radioactive nuclei as a function of time , which of the following figure best represent the from of this plot?
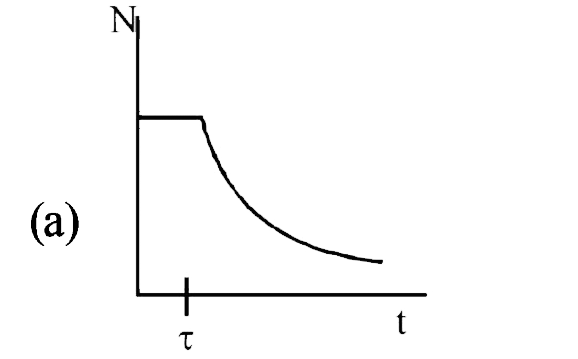
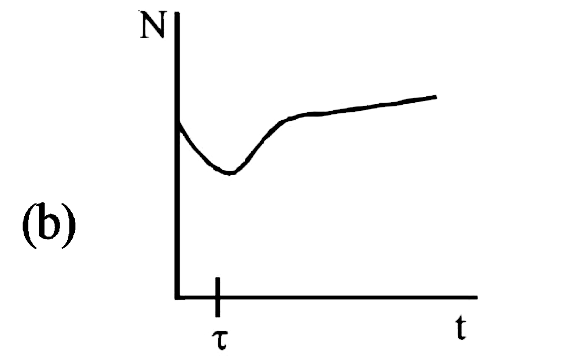
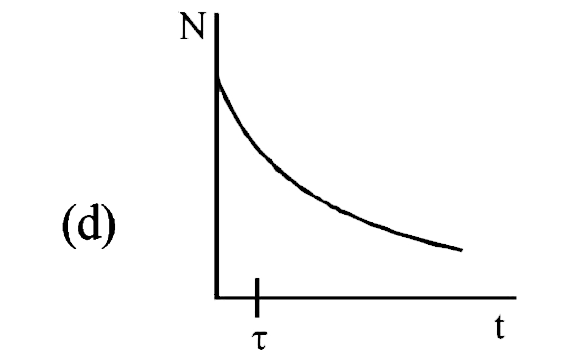
The correct Answer is:D
N1=N−λ1t=Ntτ0eoe ….(i)
asτ=1λ1
N2=N−λ2t0e=Nt5τ0e ….(i) as 5τ=1λ2
Adding (i) and (ii) we get
N=N1+N2=N0(e−t/τ+e−t/5τ)<br>(a)∈NOTthecarrectoptionasthereisatimetauforwhichNisconstantwhichmeansfortimetauthereisnoprocessofradioactivitywhichdoes¬makesame.(b)and(c)shown∫ermediate∈crease∈theνmberofradicacitivea→mwhichisIMMPOSSIBLEasN willl only decrease exponentially.
Topper's Solved these Questions
- MODERN PHYSICSBOOK - SUNIL BATRA (41 YEARS IITJEE PHYSICS)CHAPTER - MODERN PHYSICSEXERCISE - MCQ (One Correct Answer
1 Videos
- ELECTROSTATICSBOOK - SUNIL BATRA (41 YEARS IITJEE PHYSICS)CHAPTER - ELECTROSTATICSEXERCISE - Comprehension Based Questions
2 Videos
- MOVING CHARGES AND MAGNETISMBOOK - SUNIL BATRA (41 YEARS IITJEE PHYSICS)CHAPTER - MOVING CHARGES AND MAGNETISMEXERCISE - MCQs(d )
1 Videos
Similar Questions
A radioactive sample consists of two distinct species having equal number of atoms initially. The mean life of one species is τ and that of the other is 5τ. The decay products in both cases are stable. A plot is made of the total number of radioactive nuclei as a function of time. Which of the following figure best represents the form of this plot?
(a), (b), (c), (d)

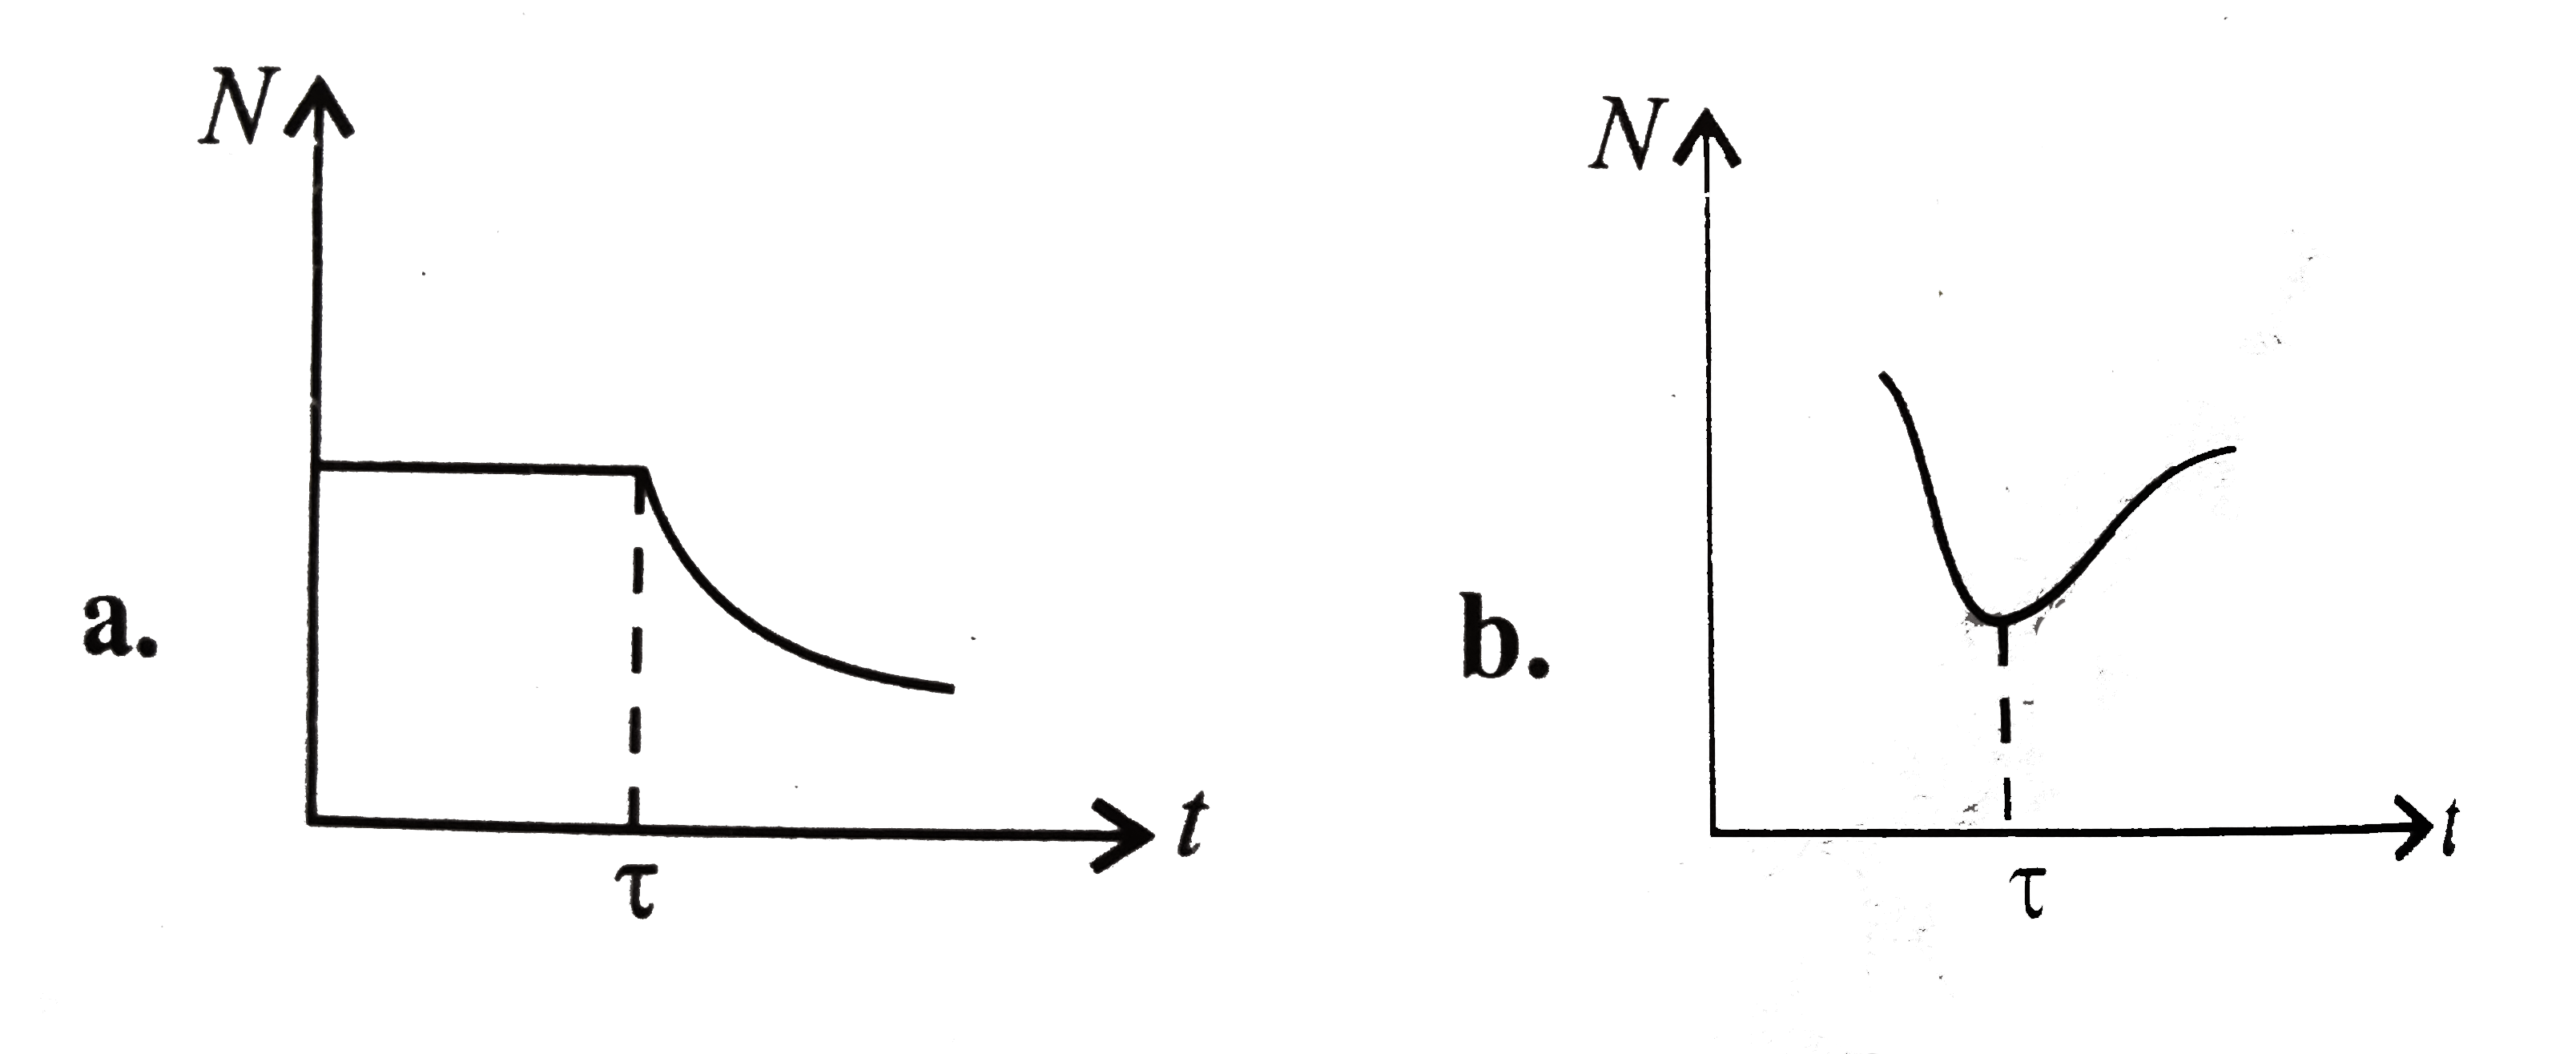
View SolutionA radioactive substance consists of two distinct having equal number of atoms initially. The mean products in both cases are stable. A plot is made of total number of radioactive nuclei as a function of time. Which of the following figures best represents the form of this plot?
View Solution
Knowledge Check
The rate of decay (R) of nuclei in a radioactive sample is plotted against time (t). Which of the following best represents the resulting curve ?
A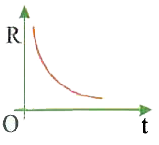 B
B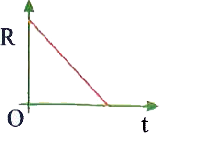 C
C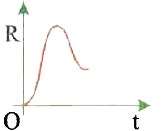 D
D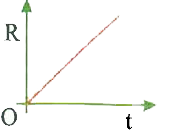
The rate of decay (R) of nuclei in a radioactive sample is plotted against time (t). Which of the following best represents the resulting curve ?
A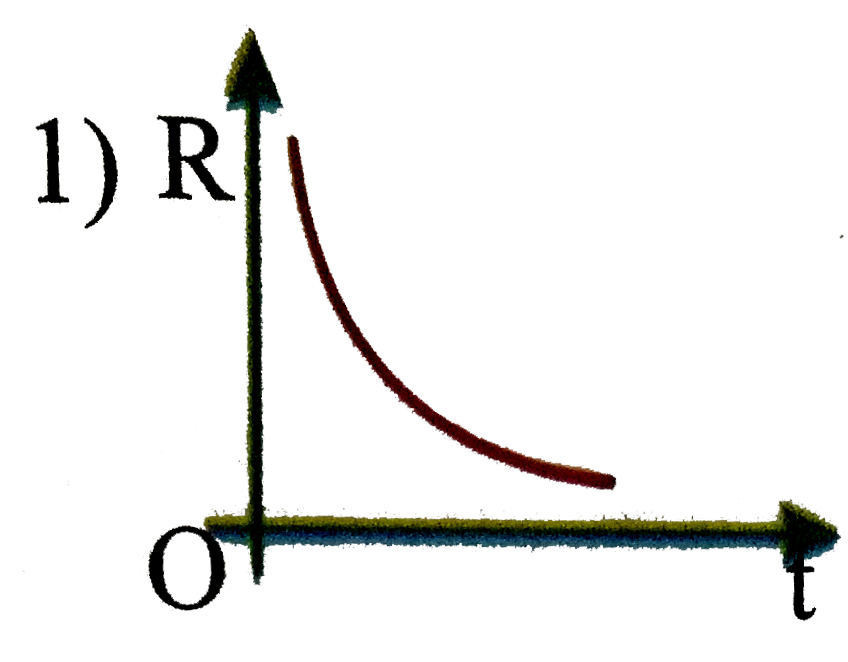 B
B C
C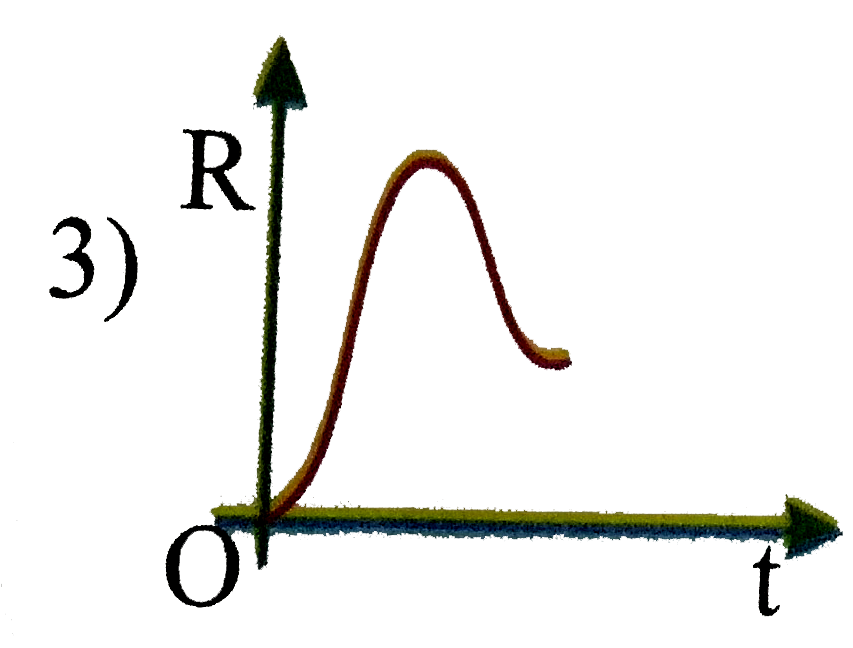 D
D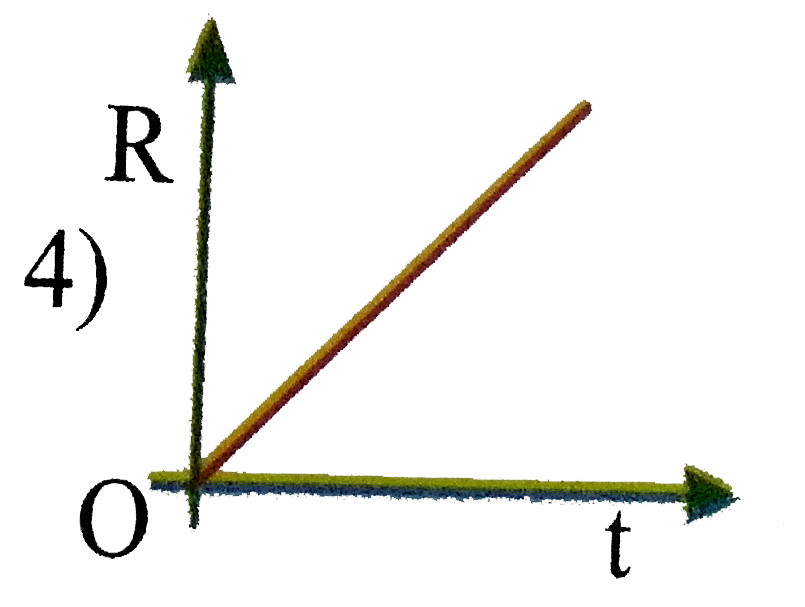
In which of the following case the total number of decays will be maximum in a time interval of t=0 to t=4 hr. The first term represents the number of nuclei at time t=0 and the second represents the half life of the radionuclide:
AN0,4hrB2N0,3hrC3N0,2hrD4N0,1hr
A radioactive sample is a mixture of two radioactive species – one having population N1has a mean life of T1 and the other one having population N2 has nuclei having mean life of t2. Find the effective mean life of the nuclei in the mixture.
View SolutionA radioactive sample consists of two isotopes one of then decays by α− emission with a half life of τ1=405s and the other one decays by β emission with half life of τ1=1620s.Attimet=0,probabilitiesof≥∈galphaandbetapartic≤somthesamp≤areequal.<br>(a)Ifapartic≤comingoutofthesamp≤isdetectedatt=1620s,wˆistheprobabilitytˆitisalphapartic≤?<br>(b)F∈dthetimewhen→talνmberofsurviv∈gνc≤iishalfthe∈itialquantity.<br>GivenIfx^(4)+4x-2.5=0thenx=0.59<br>"log"_(10)2=0.301, "log"_(10)5.9=0.774
View SolutionA radio nuclide sample has N0 nuclei at t=0. Its number of undecayed nuclei get reduced to N0e at t=τ. What does the term ‘τ’ stand for ? Write in terms of 'τ', the time interval T in which half of the original number of nuclei of this radio nuclide would have got decayed.
View SolutionThe half life of a radioactive element A is same as mean life time of another radioactive element B.Initially, both have same number of atoms. B decays faster than A . Why?
View SolutionA stable nuclei C is formed from two radioactive nuclei A and B with decay constant of λ1 and λ2 respectively. Initially, the number of nuclei of A is N0 and that of B is zero. Nuclei B are produced at a constant rate of P. Find the number of the nuclei of C after time t.
View Solution
