A radioactive substance consists of two distinct having equal number of atoms initially. The mean products in both cases are stable. A plot is made of total number of radioactive nuclei as a function of time. Which of the following figures best represents the form of this plot?
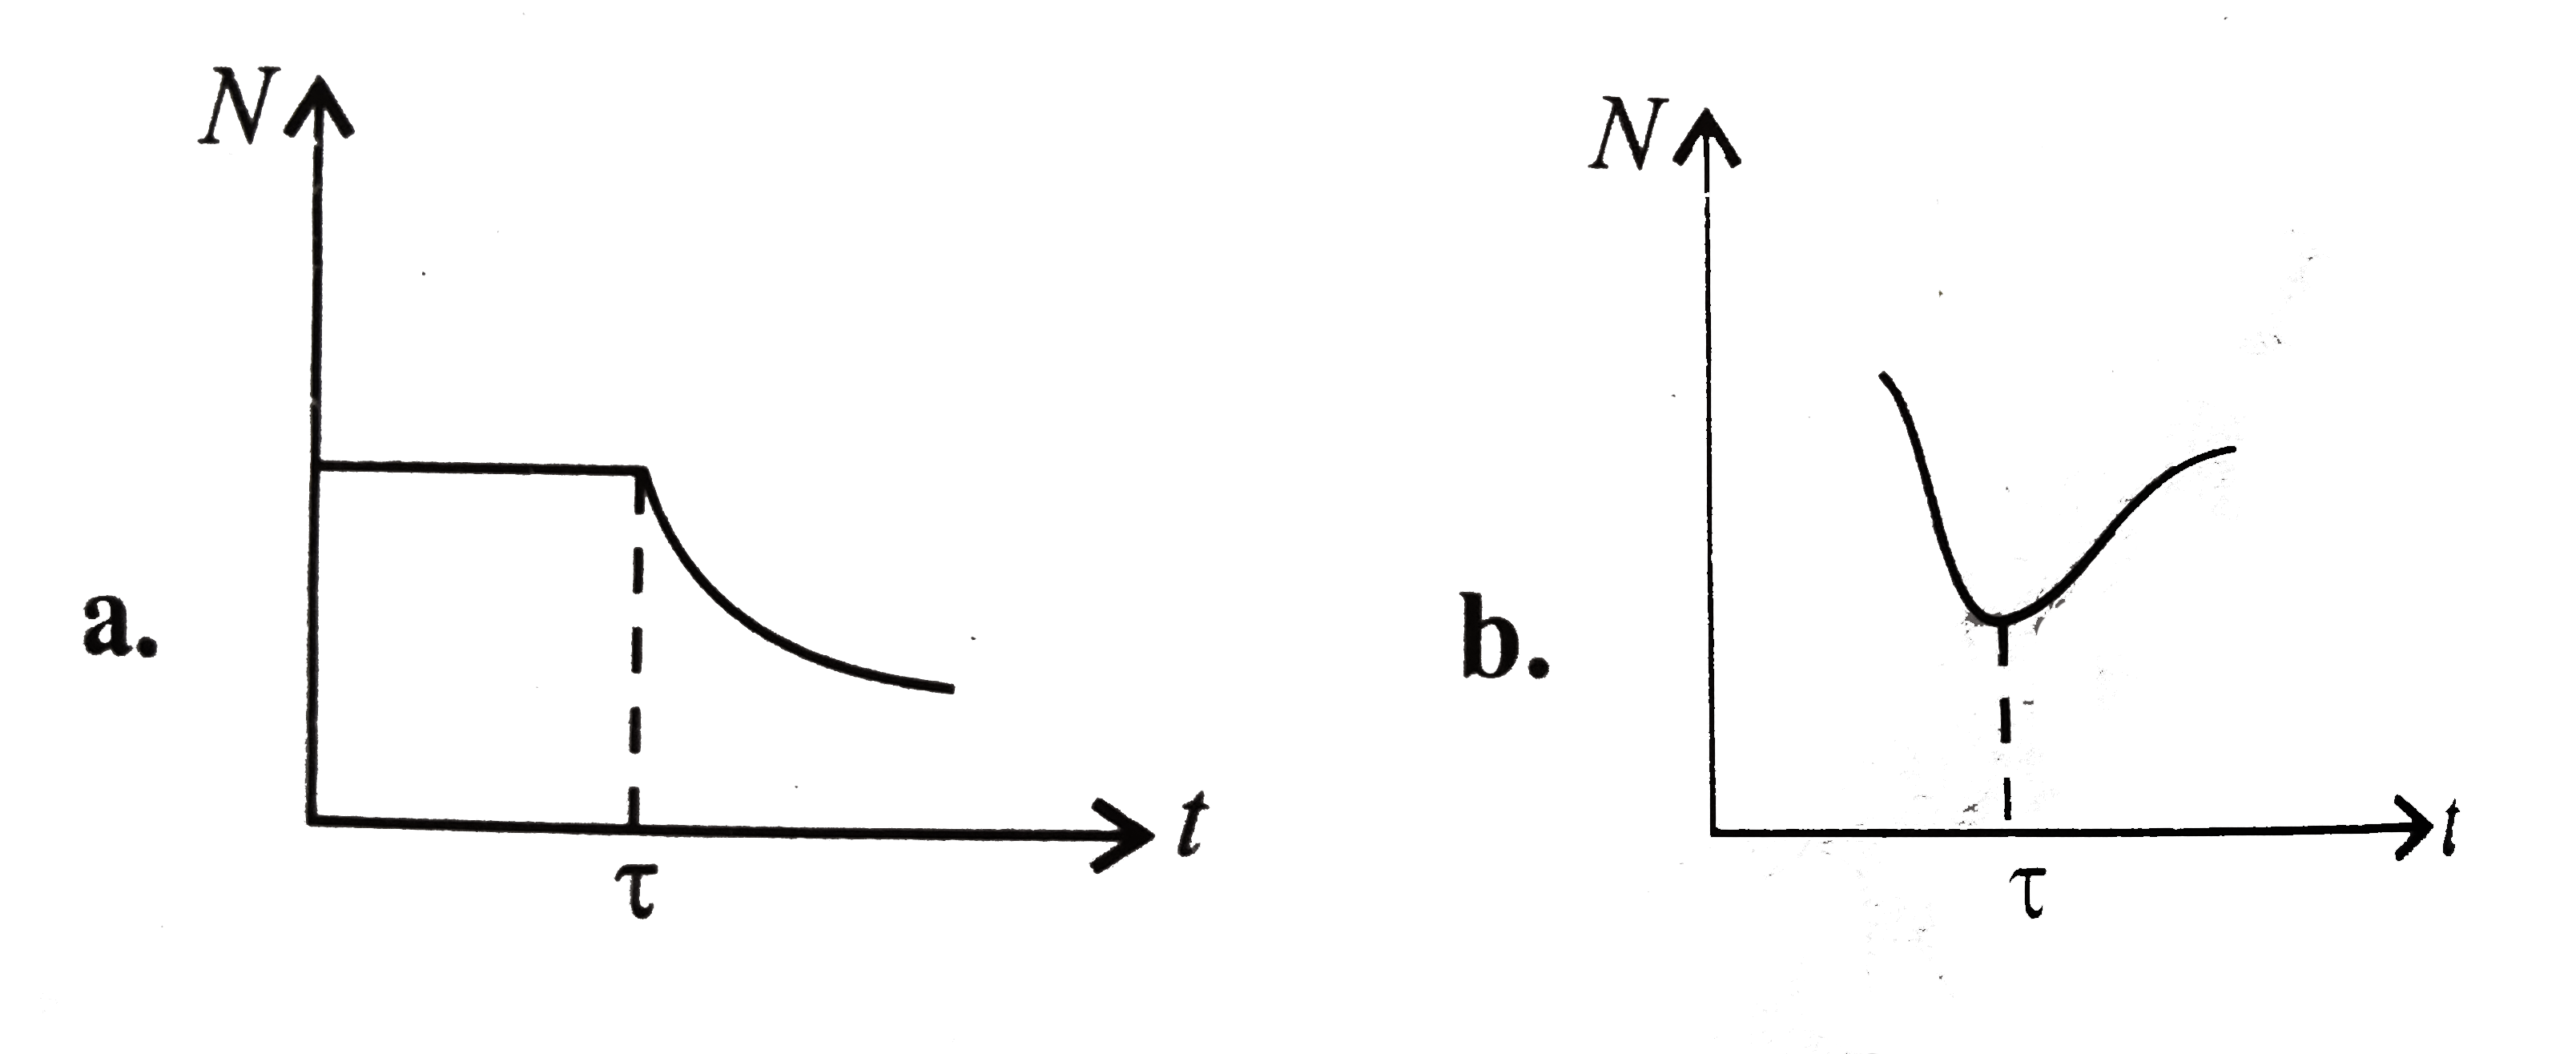
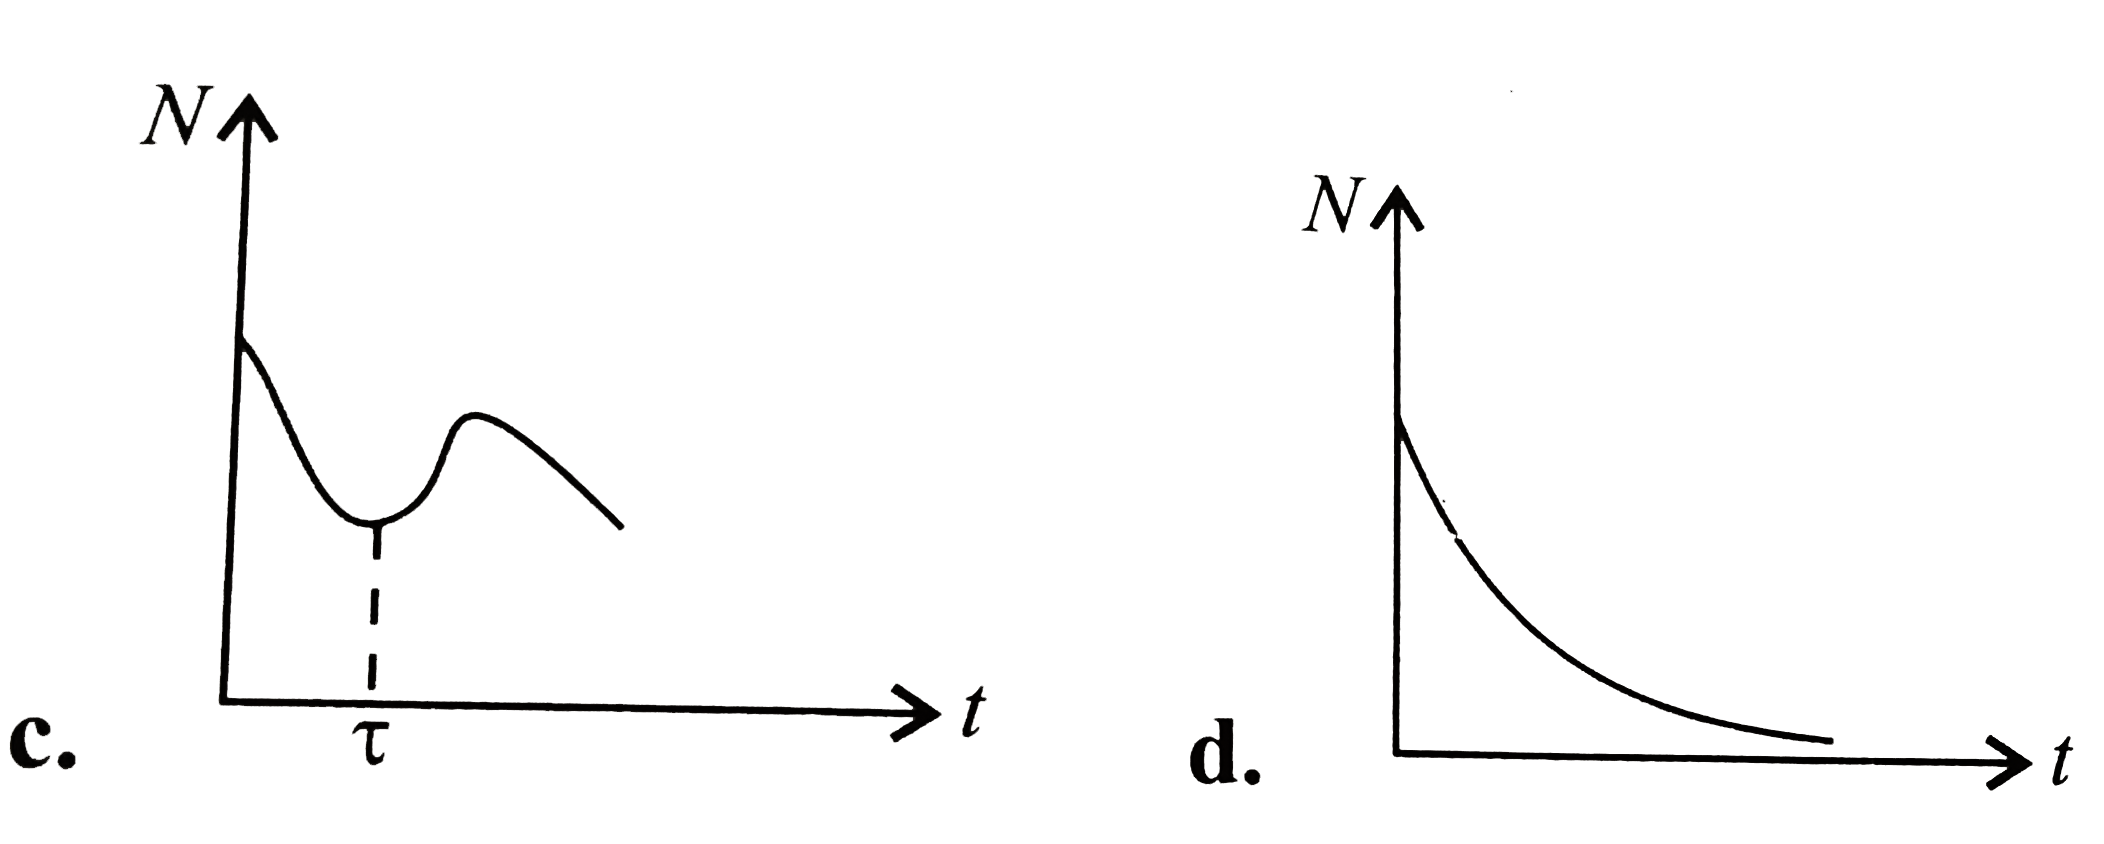
The decrease of radioactive element (parent element) follows the exponential functions.
Topper's Solved these Questions
- BOOK - CENGAGE CHEMISTRYCHAPTER - NUCLEAR CHEMISTRYEXERCISE - Solved Example18videos
NUCLEAR CHEMISTRY
- BOOK - CENGAGE CHEMISTRYCHAPTER - NUCLEAR CHEMISTRYEXERCISE - Ex6.1 Objective15videos
NUCLEAR CHEMISTRY
- BOOK - CENGAGE CHEMISTRYCHAPTER - NCERT BASED EXERCISEEXERCISE - Nuclear Chemistry (NCERT Exercise)29videos
NCERT BASED EXERCISE
- BOOK - CENGAGE CHEMISTRYCHAPTER - ORGANIC COMPOUNDS WITH FUNCTIONAL GROUPEXERCISE - Archives Analytical And Descriptive24videos
ORGANIC COMPOUNDS WITH FUNCTIONAL GROUP
Similar Questions
A radioactive sample consists of two distinct species having equal number of atoms initially. The mean life of one species is τ and that of the other is 5τ. The decay products in both cases are stable. A plot is made of the total number of radioactive nuclei as a function of time. Which of the following figure best represents the form of this plot?
(a), (b), (c), (d)
 View Solution
Two radioactive substances X and Y initially contain an equal number of atoms. Their half-lives are 1 hour and 2 hours respectively. Then the ratio of their rates of disintergration after two hours is
View Solution
Knowledge Check
- Question 1 - Select One
A radicactive sample consider of two distinct species having equial number initially . The mean life time of one species is τ and that of the other is 5τ . The decay prodects in both cases are stable . A plot is made of the total number of radioactive nuclei as a function of time , which of the following figure best represent the from of this plot?
A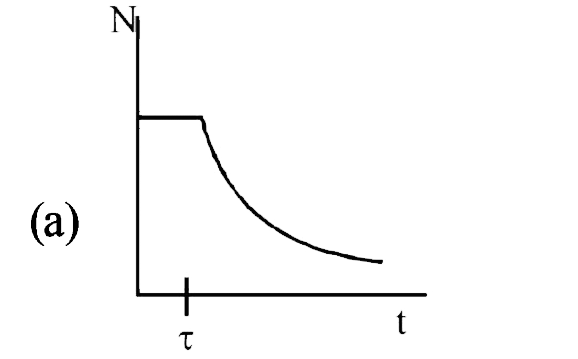 B
B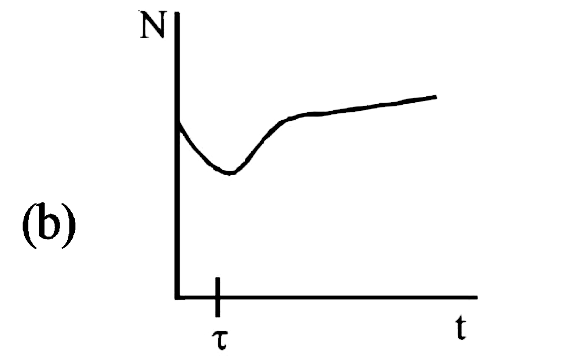 CD
CD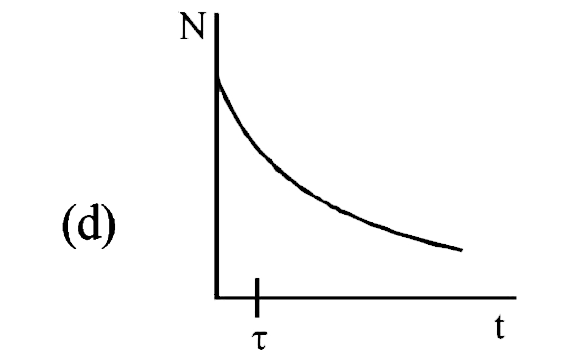
- Question 2 - Select One
The rate of decay (R) of nuclei in a radioactive sample is plotted against time (t). Which of the following best represents the resulting curve ?
A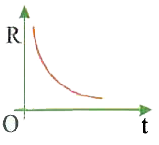 B
B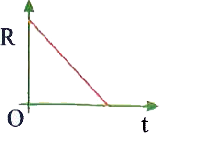 C
C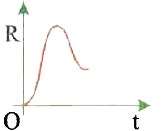 D
D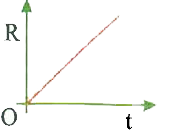
- Question 3 - Select One
The rate of decay (R) of nuclei in a radioactive sample is plotted against time (t). Which of the following best represents the resulting curve ?
A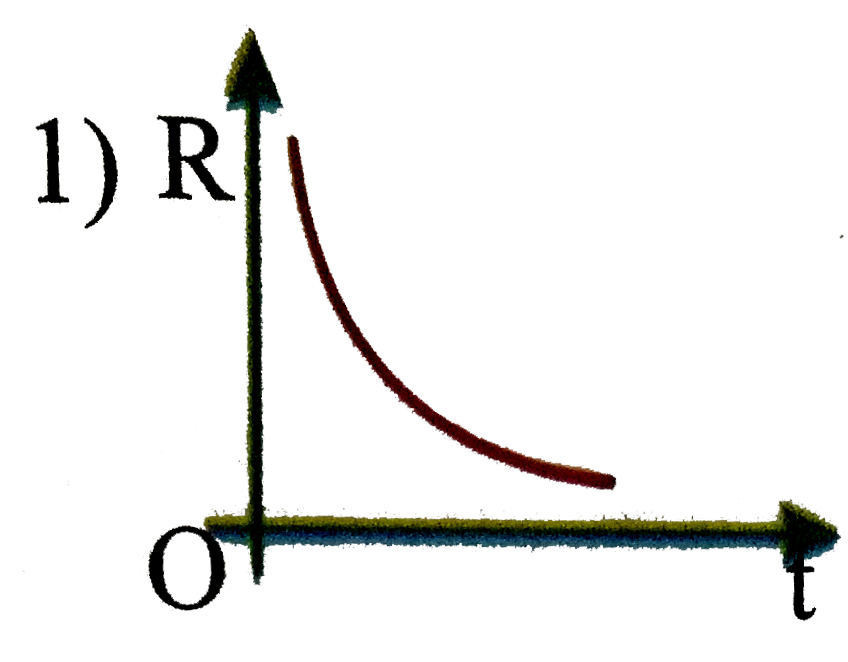 B
B C
C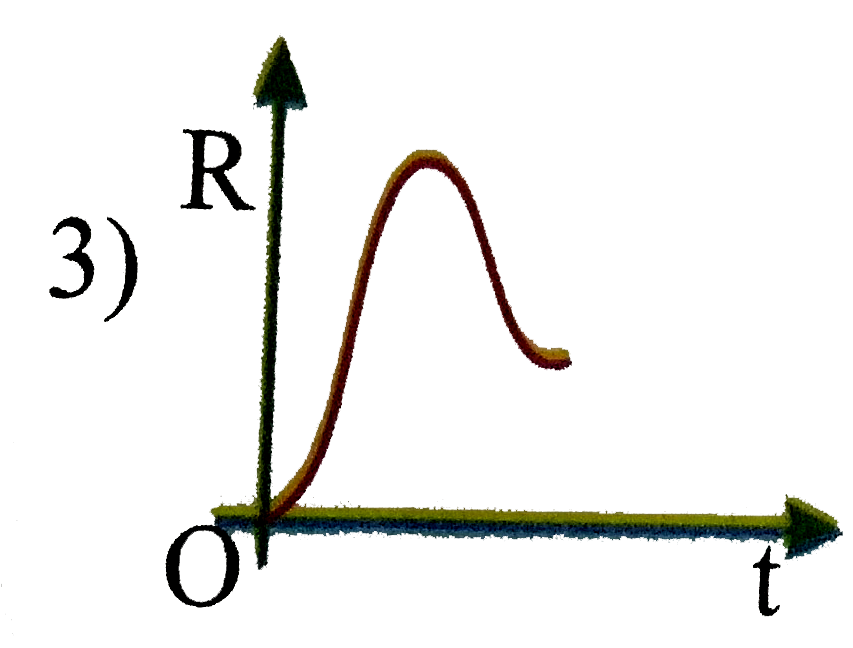 D
D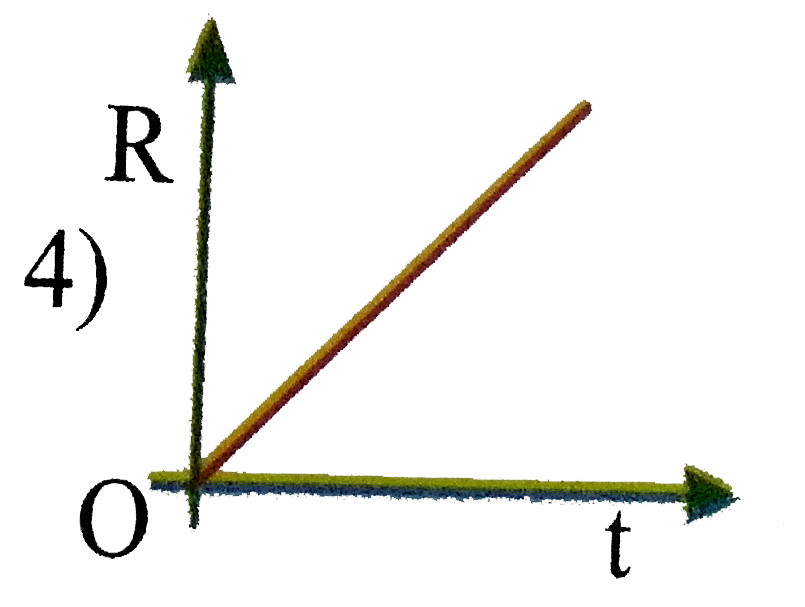
In a radioactive disintegration, the ratio of initial number of atoms to the number of atoms present at an instant of time equal to its mean life is
View SolutionTwo radioactive substances X and Y initially contain an equal number of atoms. Their half-lives are 1 hour and 2 hours respectively. Then the ratio of their rates of disintergration after two hours is
View SolutionTwo radioactive substance X and Y initially contain equal number of nuclei. X has a half life of 1 hour and Y has a half-life of 2 hours. After 2 hours the ratio of activity of X to that of y is
View SolutionTwo radioactive substances have half-lives T and 2T. Initially, they have equal number of nuclei. After time t=4T, the ratio of their number of nuclei is x and the ratio of their activity is y. Then,
View SolutionTwo radioactive substances A and B have half lives of T and 2T respectively. Samples of a and b contain equal number of nuclei initially. After a time 4T, the ratio of the number of undecayed nuclei of A to the number if undecayed nuclei of A to the number of undeacyed nuclei of B is
View Solution

