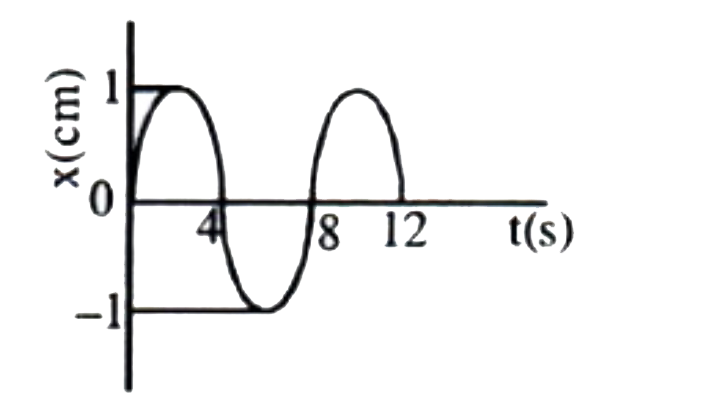
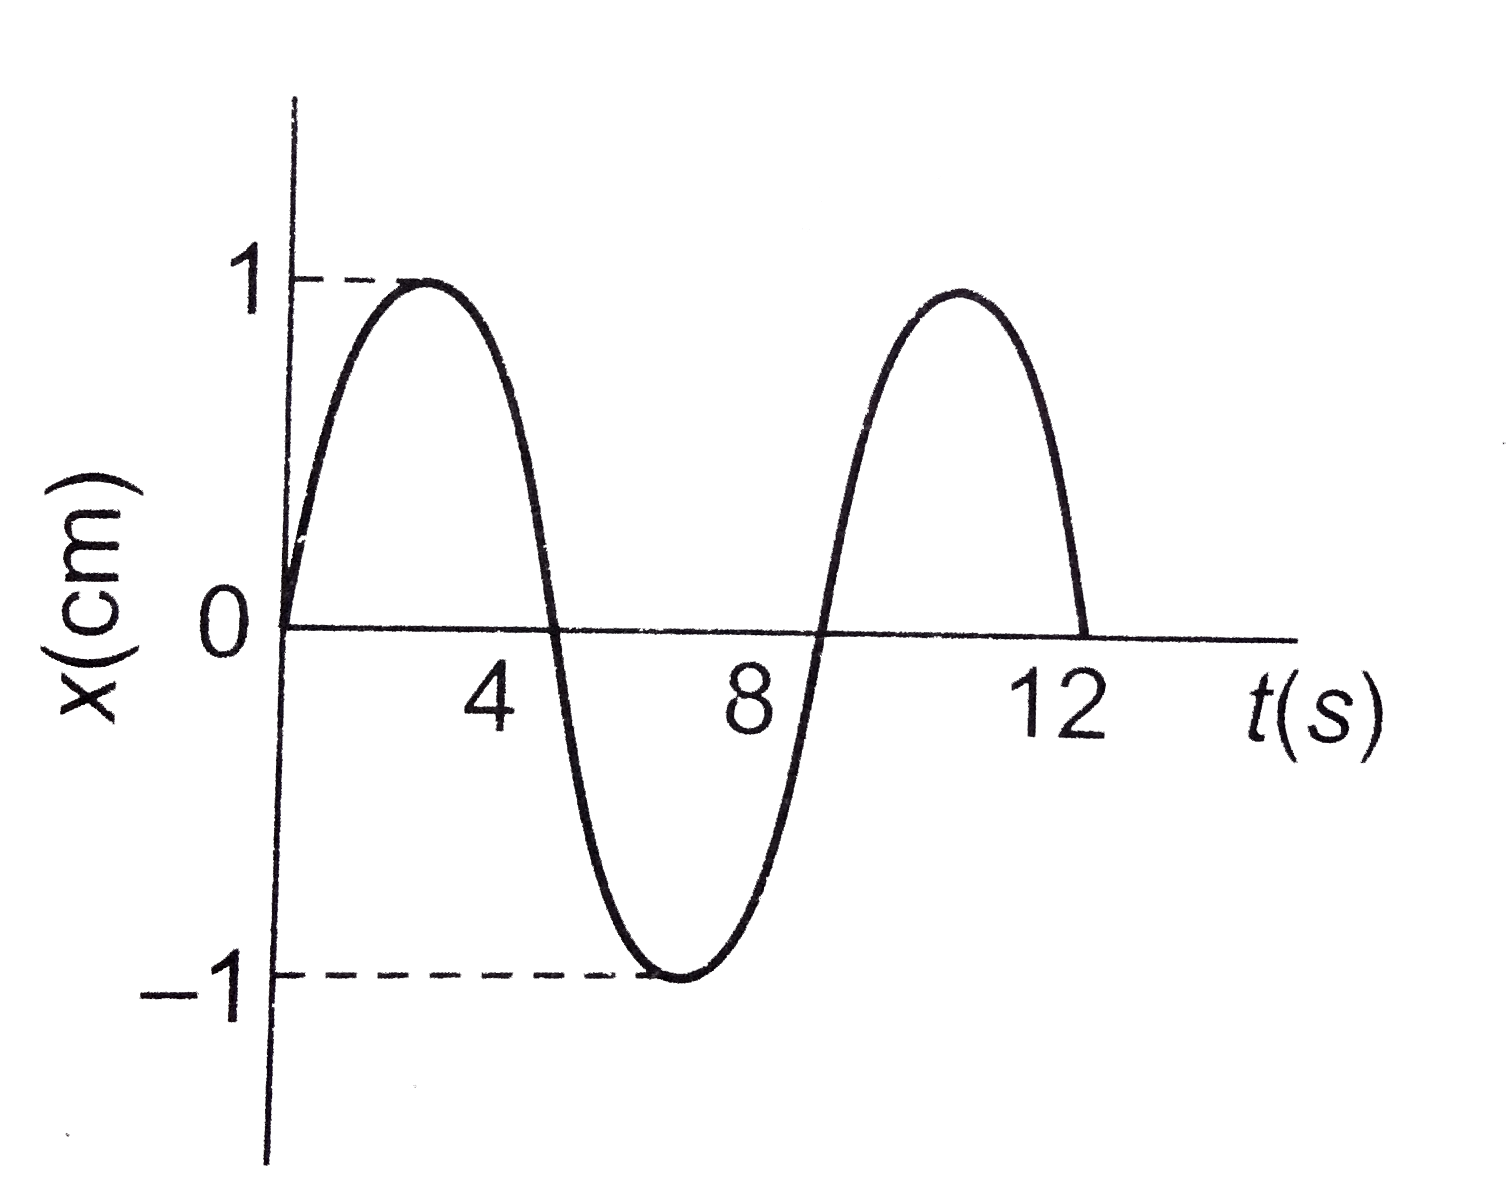
The graph of a particle undergoing simple harmonic motion is shown in figure. Acceleration of particle at is

A
B
C
D
Video Solution
Text Solution
The correct Answer is:D
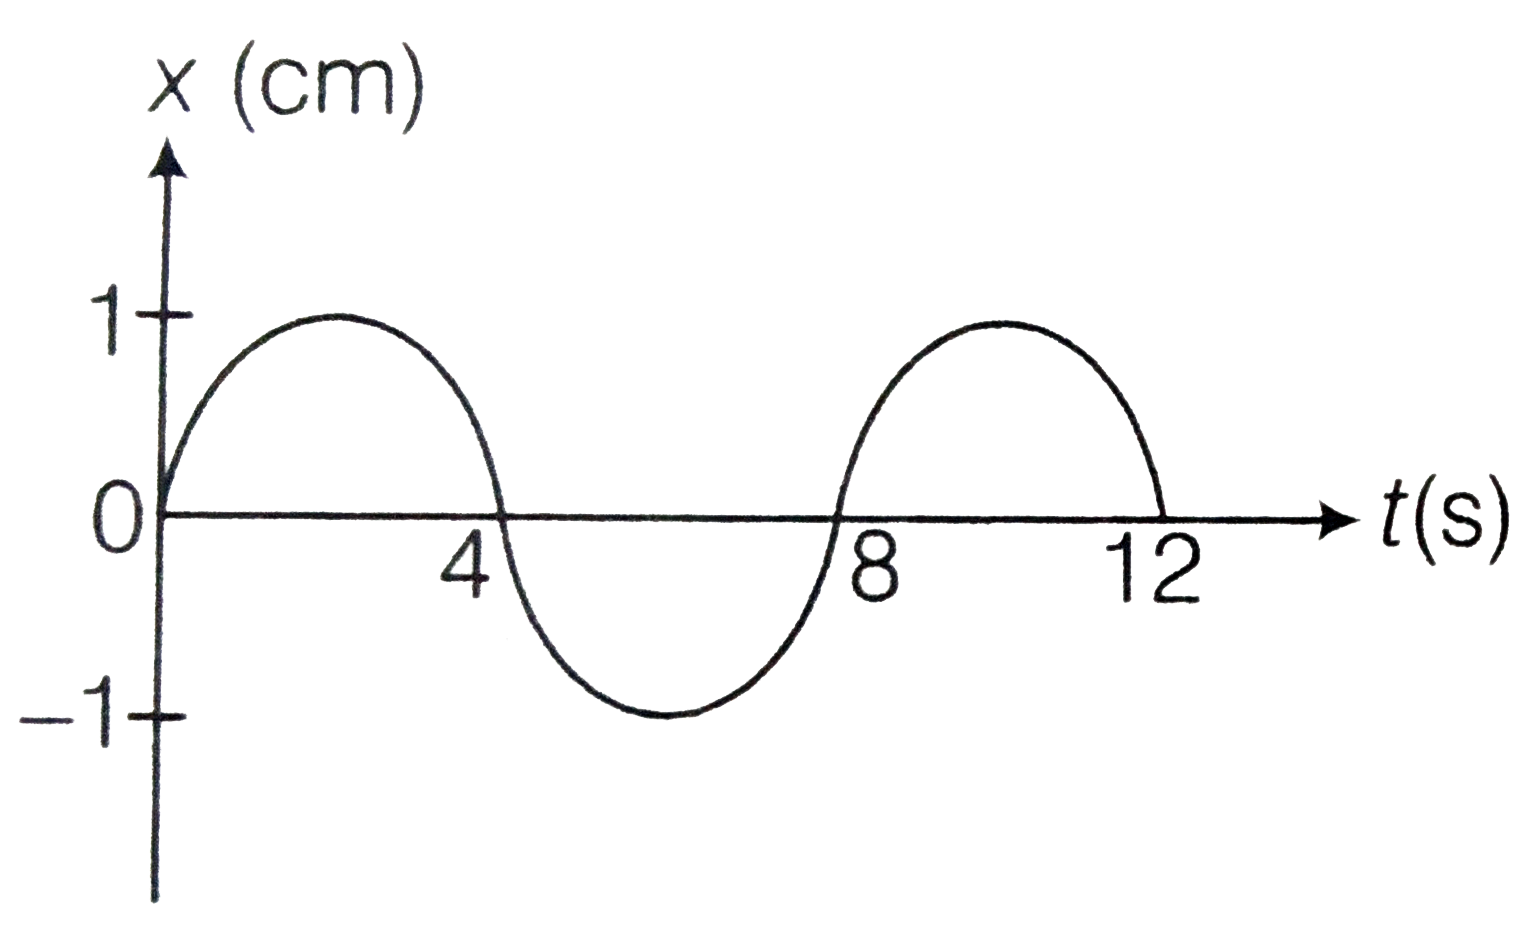
at time , the displacement , Therefore , the curve is a sinusoidal curve. It represents SHM whose amplitude
.
As,
Acceleration,
At,
Acceleration ,
|
Topper's Solved these Questions
Similar Questions
Knowledge Check
The x−t graph of a particle undergoing simple harmonic motion is shown below. The accelertion of the particle at t=4/3s is
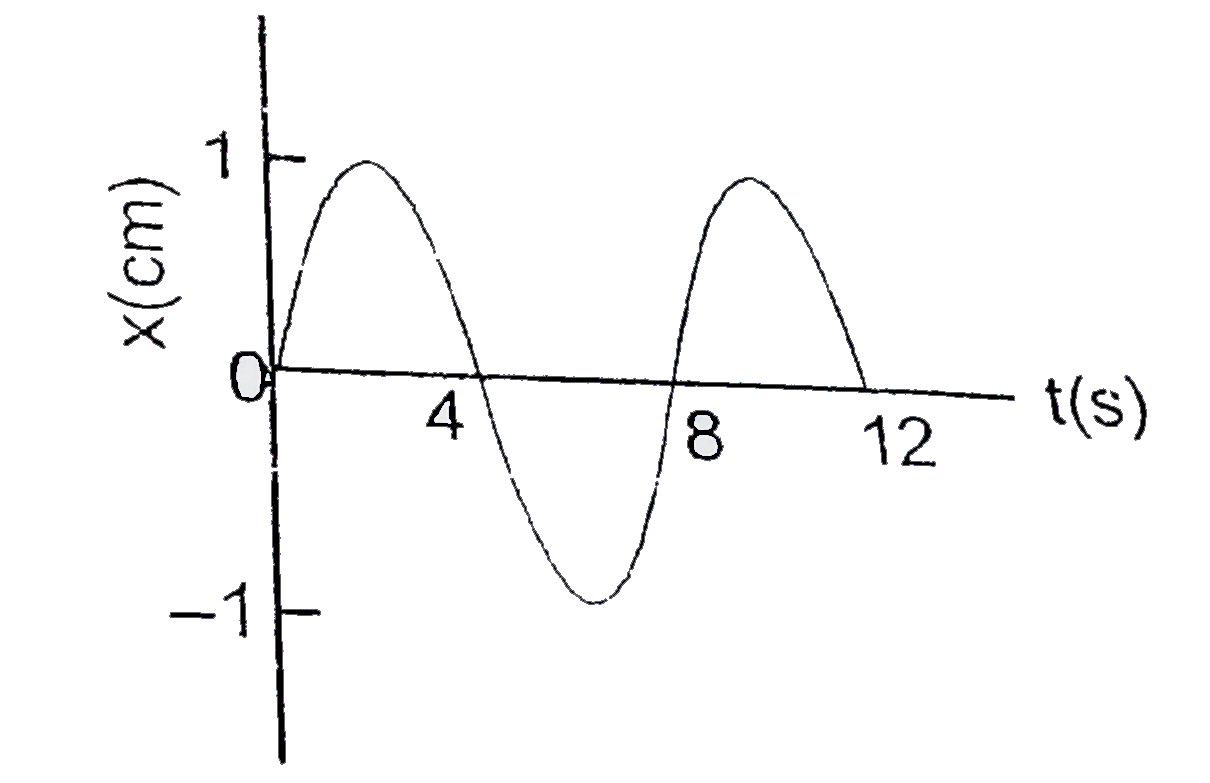 A√332π2cm/s2B−π232cm/s2Cπ232cm/s2D−√332π2cm/s2
The x-t graph of a particle undergoing simple harmonic motion is shown below. The acceleration of the particle of t=4/3s is
 A√332π2cm/s2B−π232cm/s2Cπ232cm/s2D−√332π2cm/s2
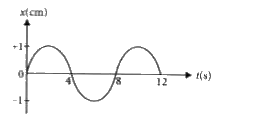
The x-t graph of a particle undergoing SHM is as shown in figure. The acceleration of the particle at t=2/3 is
 A√332π2cms−2B−π232cms−2Cπ232cms−2D−√332π2cms−2
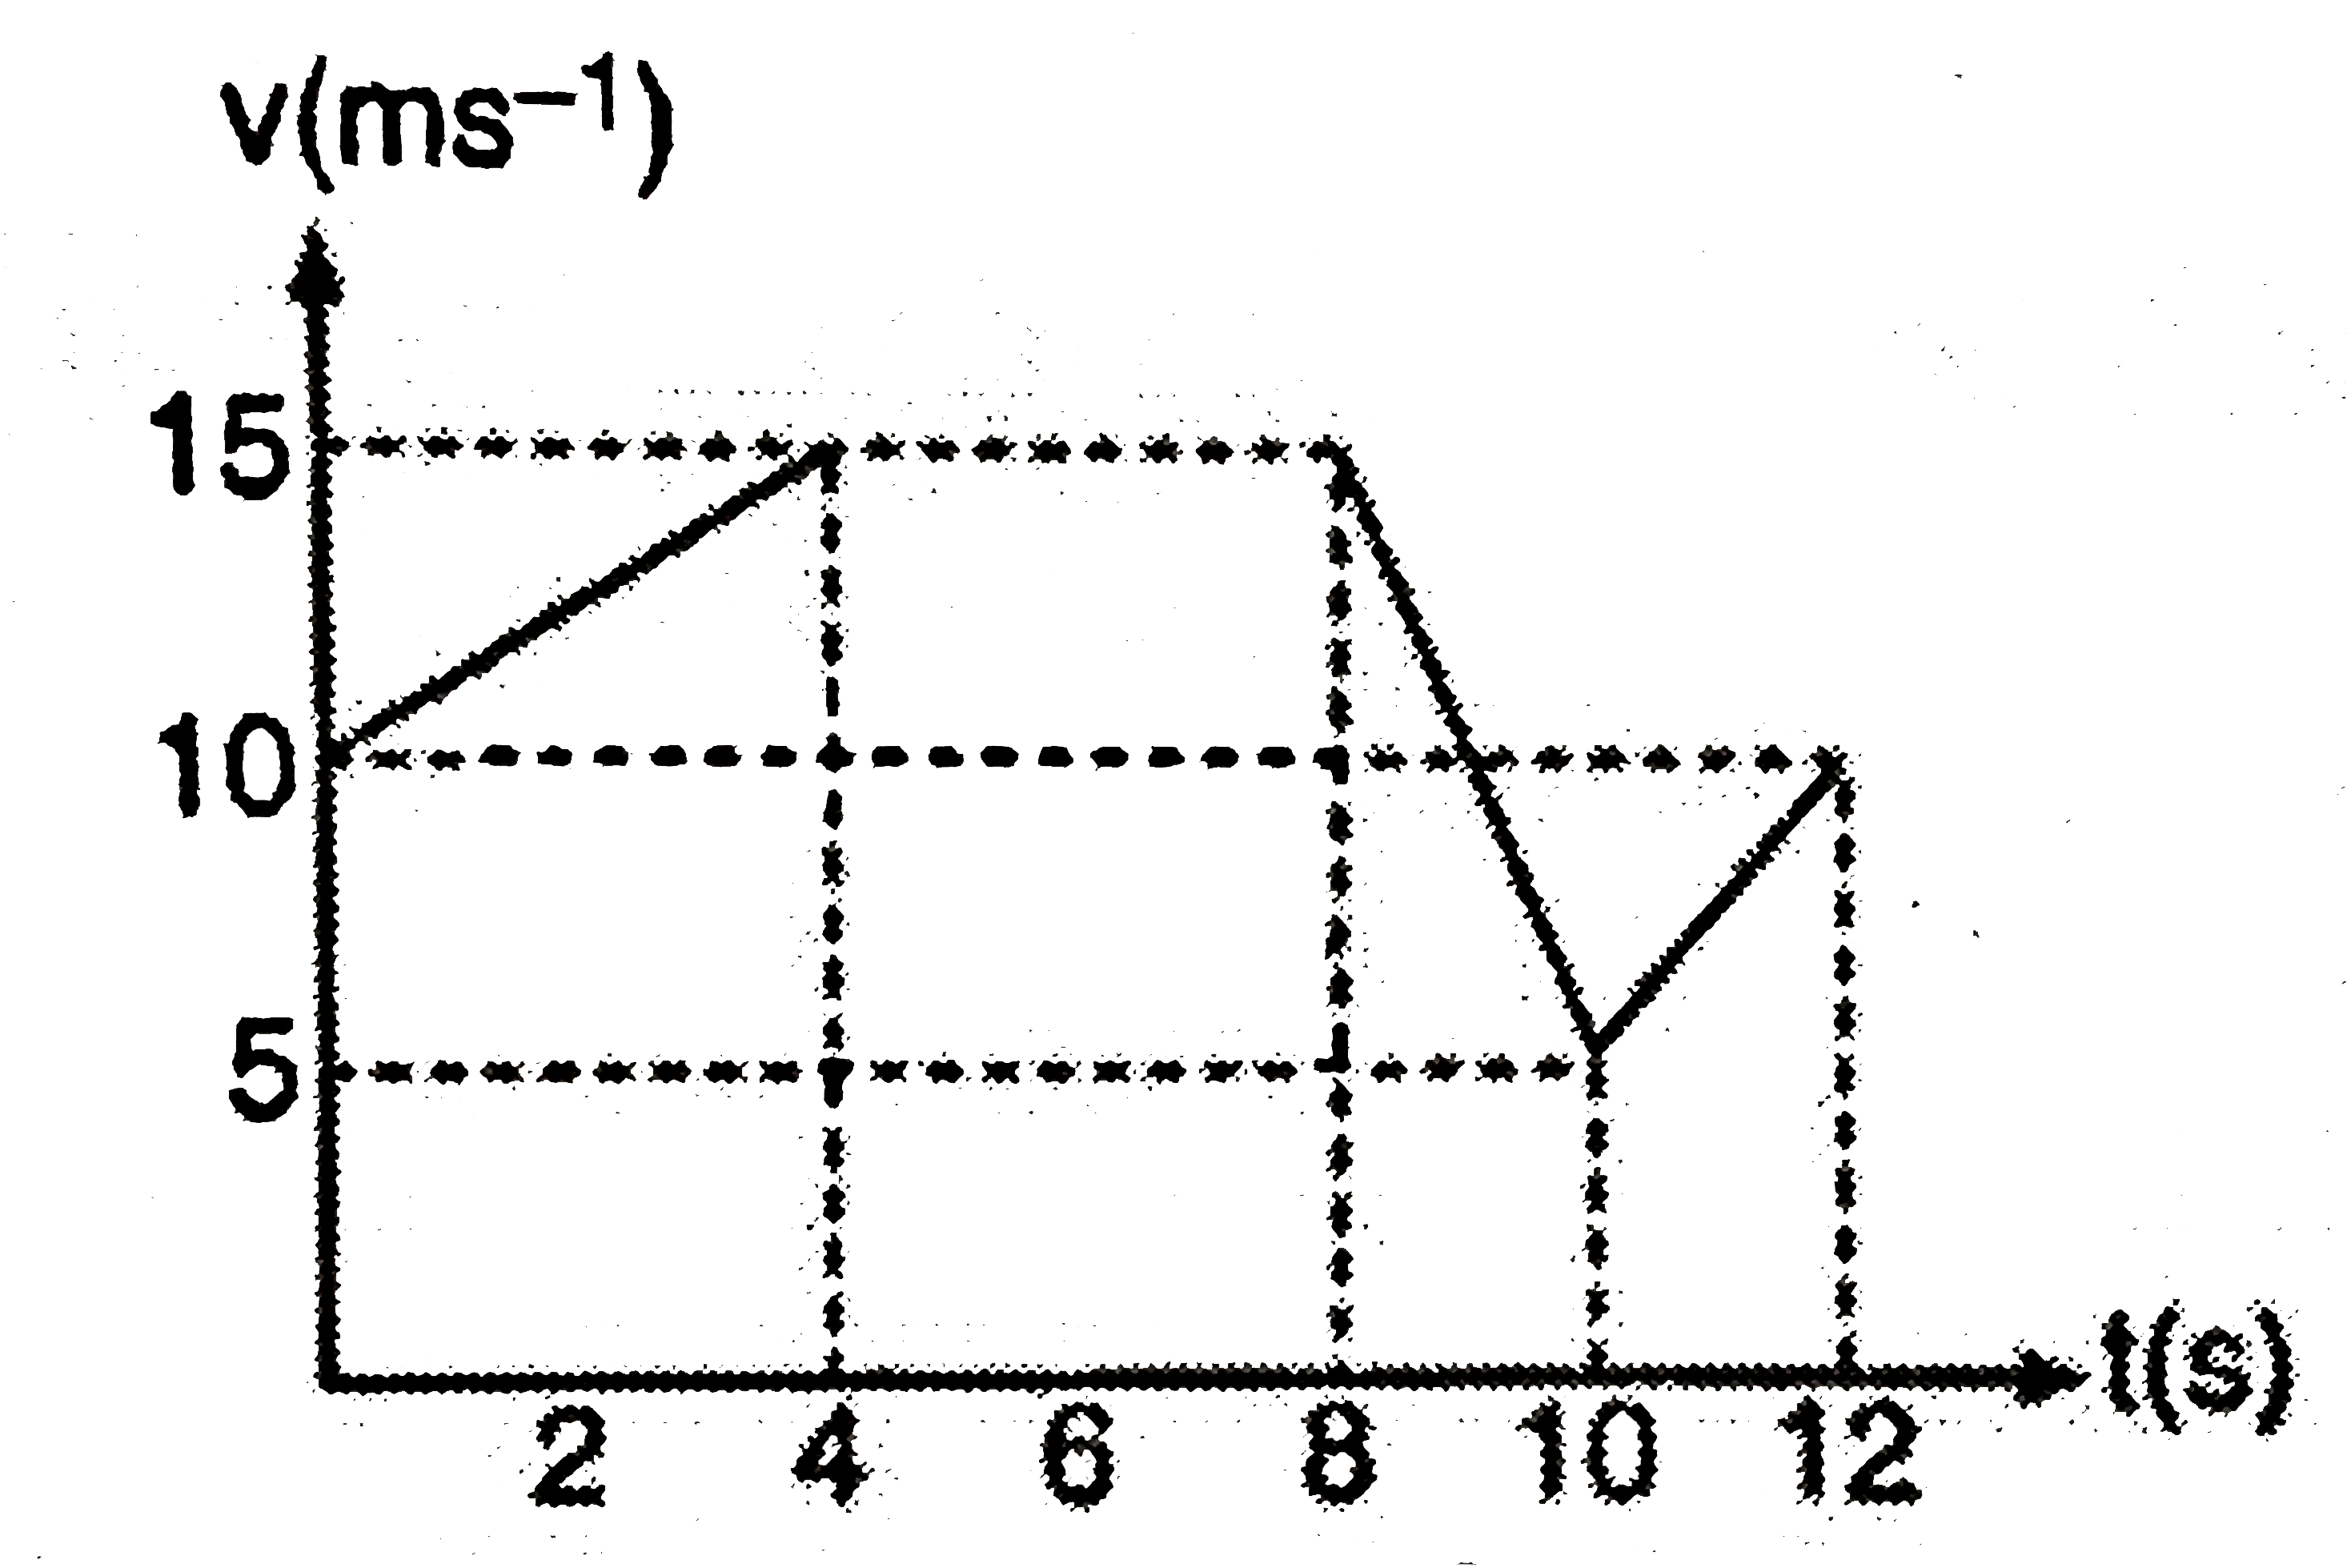
The velocity -time (v−t) graph of a particle moving in a straight line is shown in figure. The acceleration of the particle at t=9 is:
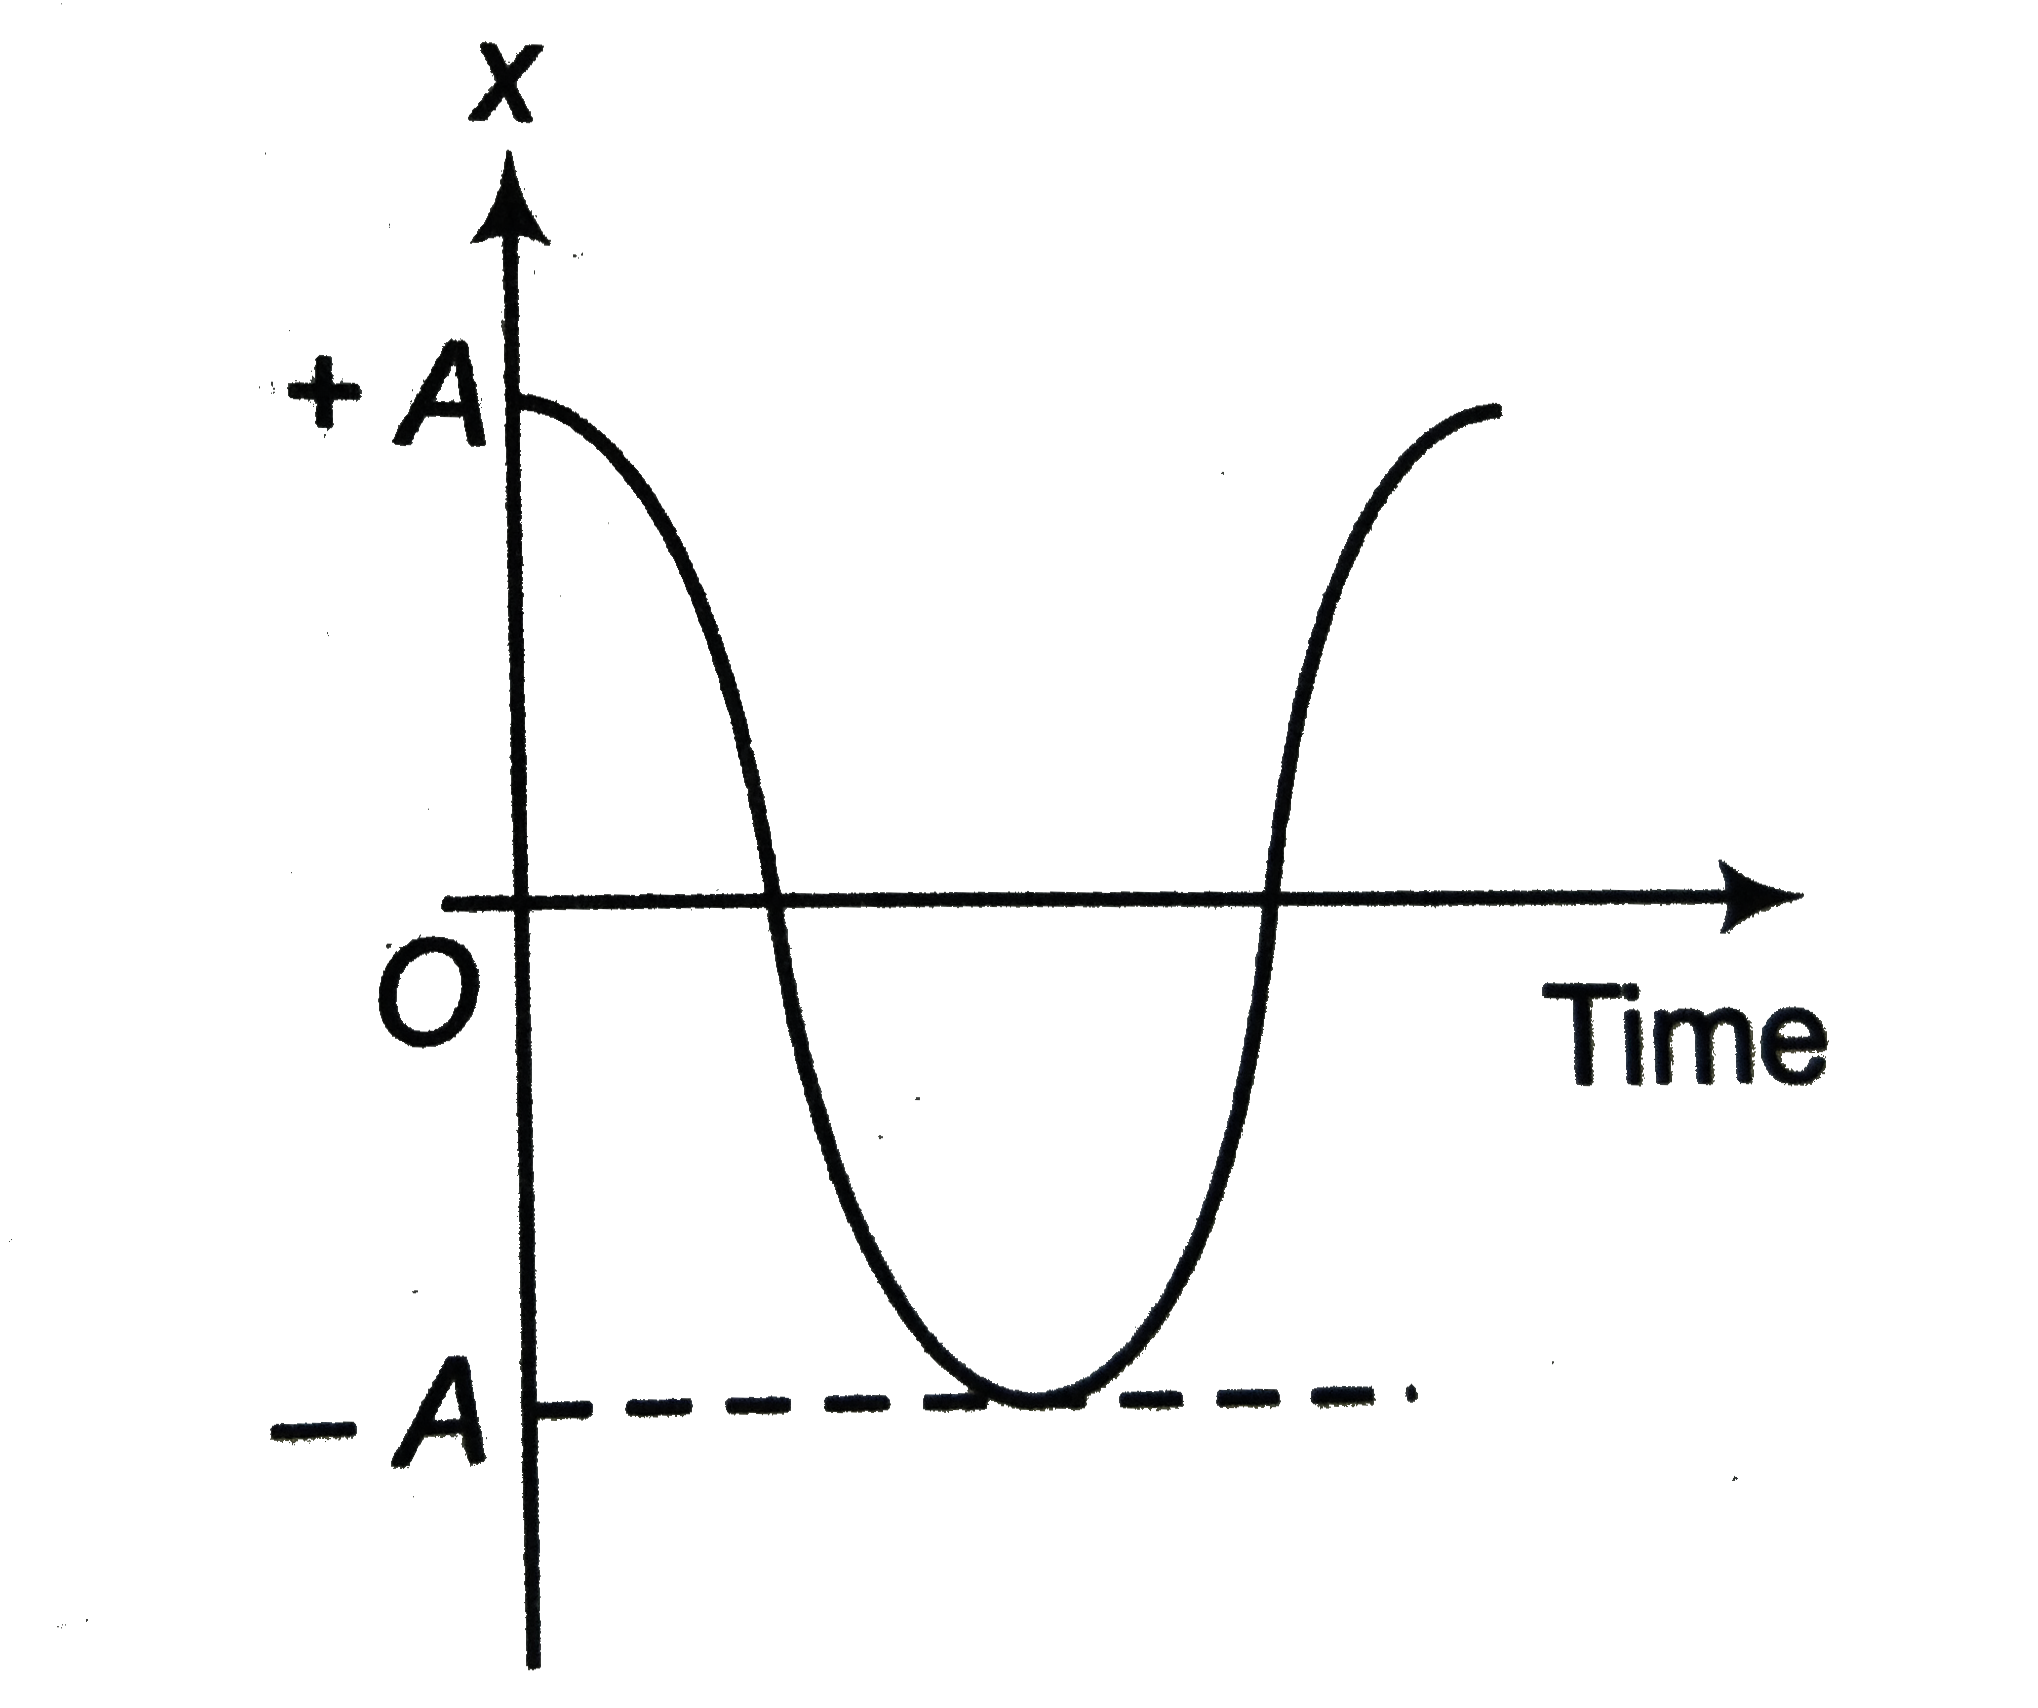
View SolutionThe displacement - time (x−t) graph of a particle executing simple harmonic motion is shown in figure. The correct variation of net force F action on the particle as a function of time is
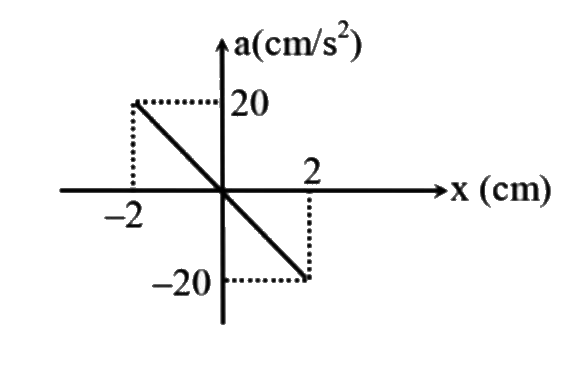
View SolutionThe acceleration displacement graph of a particle executing simple harmonic motion is shown in figure. The time period of simple harmonic motion is
View SolutionThe phase (at a time t) of a particle in simple harmonic motion tells
View SolutionIn simple harmonic motion,the particle is
View Solution

